
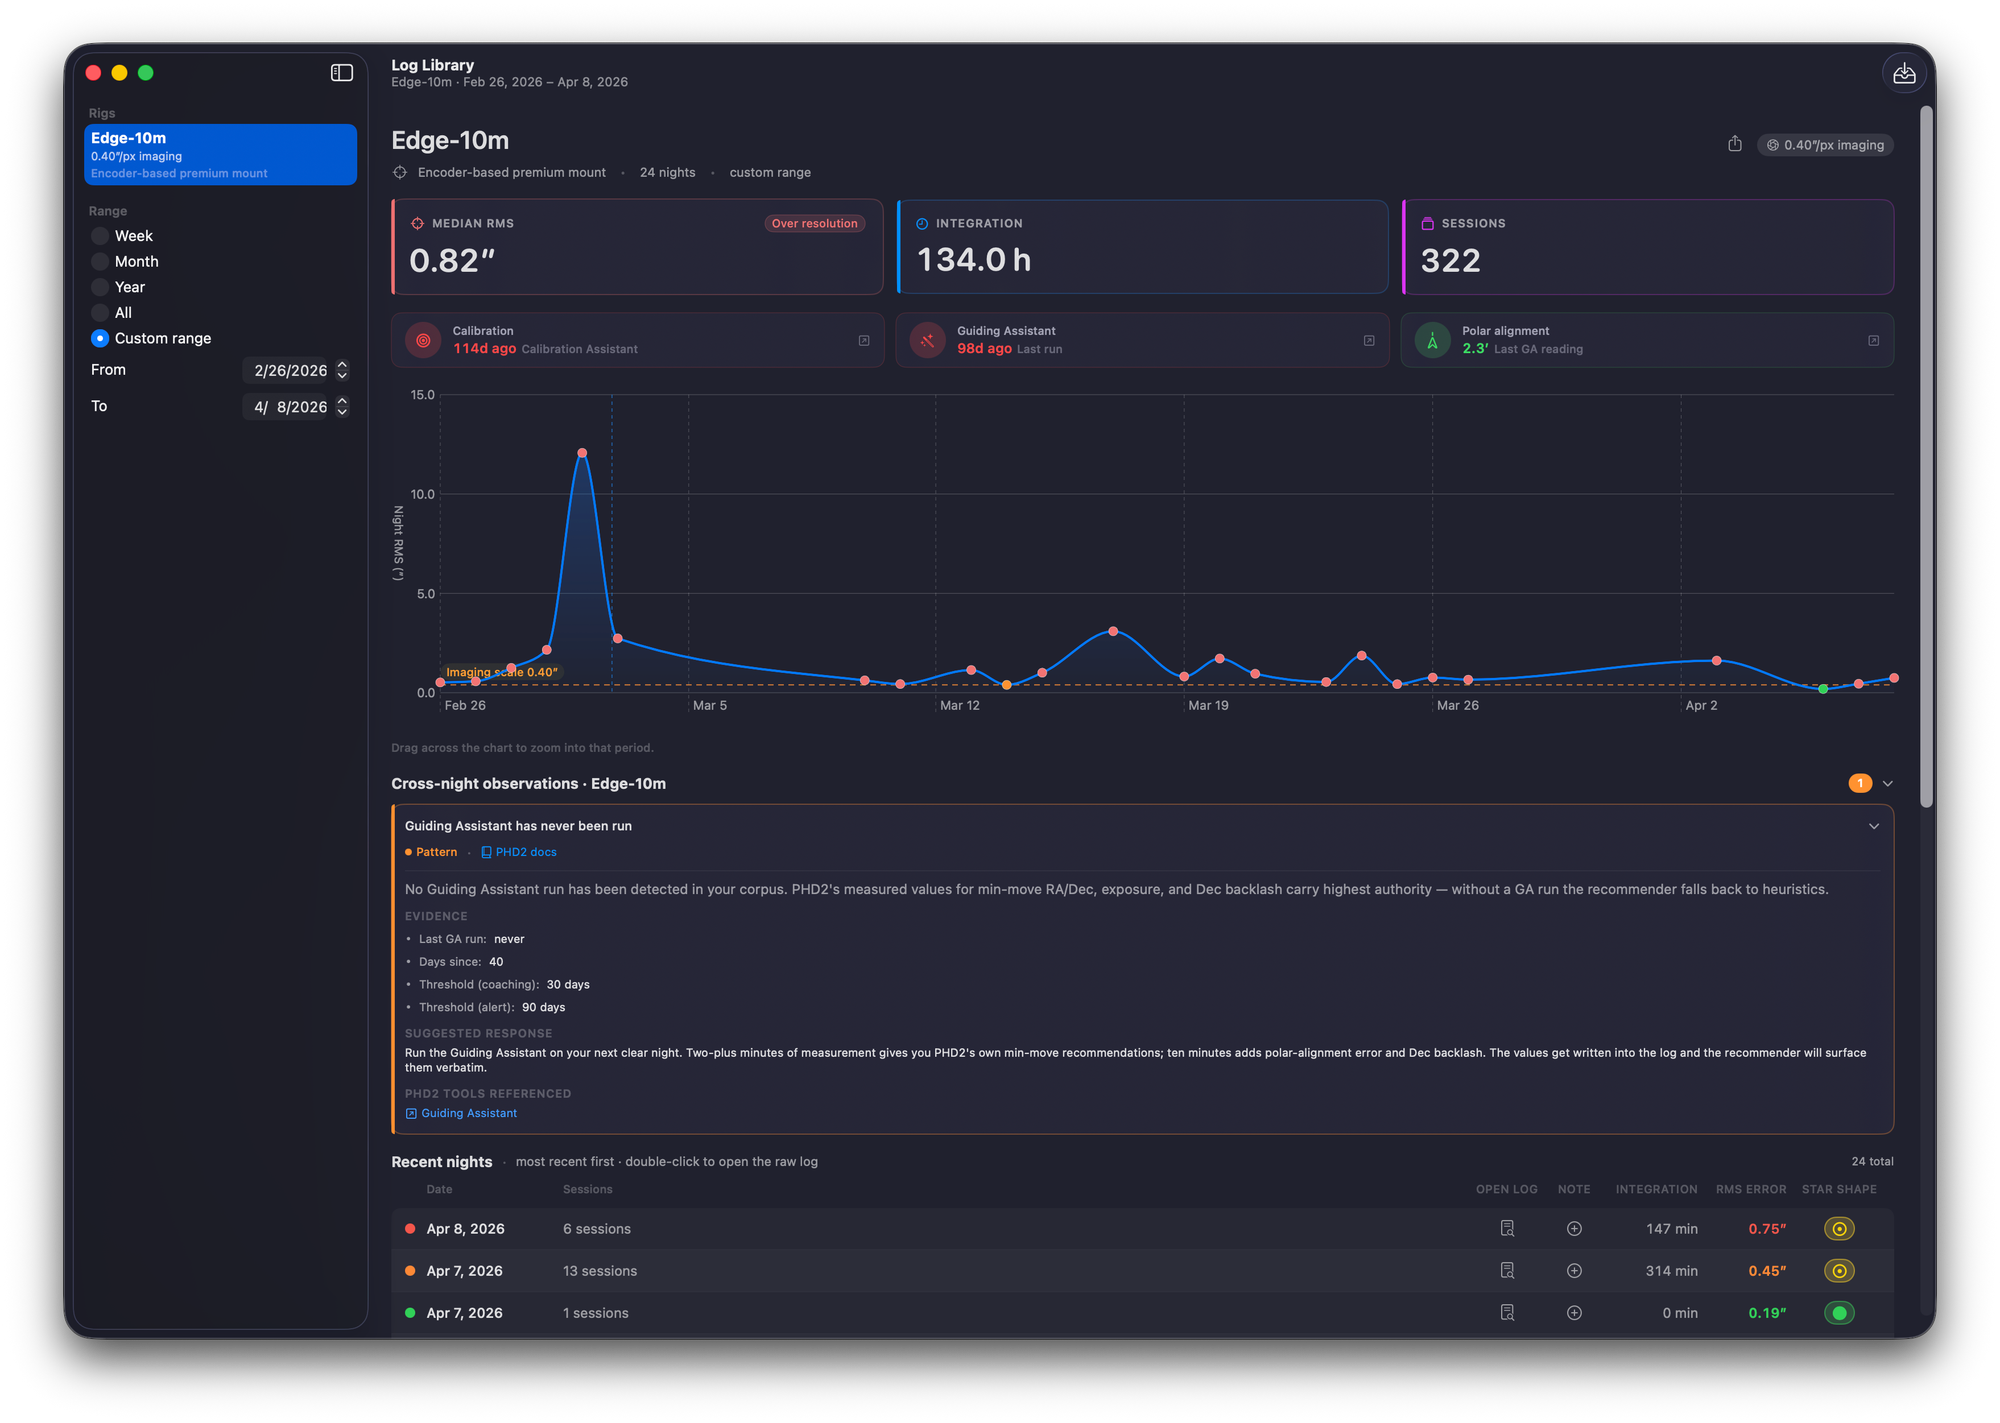
Ephemeris is a free, open-source Mac app that reads PHD2 guide logs. Version 2.0 is out today, and it adds the one thing 1.0 could never do: remember. Where 1.0 analyzed a single night, 2.0 keeps a library of every night your rig has recorded and tells you what it notices across all of them.
The single-log side hasn't gone anywhere. You still open a night, see every guiding and calibration session in order, chart RA and Dec error, plot the calibration cross, run an FFT and find your worm period. That's still what I reach for the morning after a session. 2.0 is about the question one log can't answer: is this getting better? Was that a bad night, or a bad setup? Has anything actually changed since I re-tightened the OAG?
The Log Library
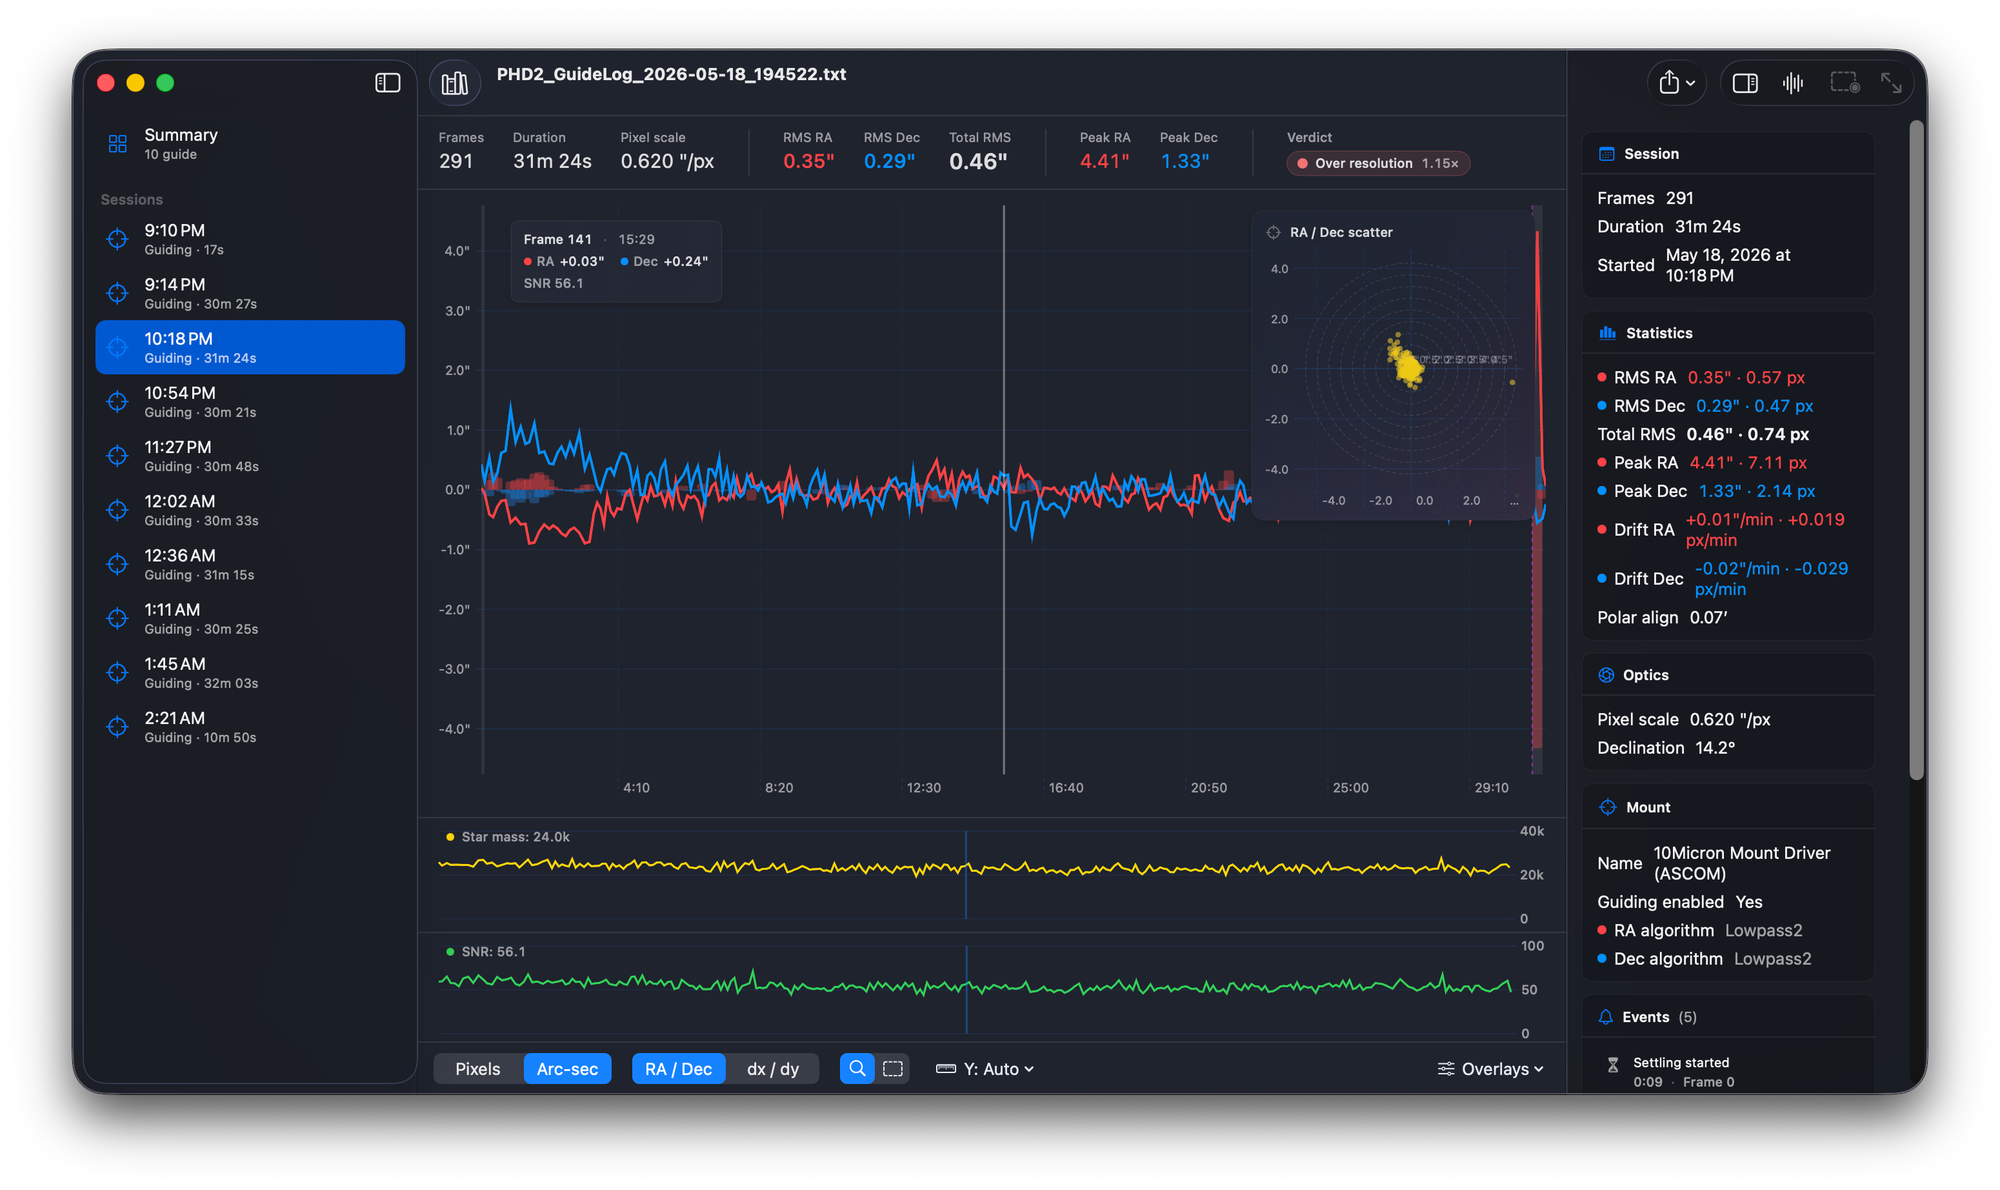
Point Ephemeris at a folder of logs and it imports the lot, skipping the ones it already has, so you can re-import the same directory next month without making a mess. Everything lands under a rig profile: focal length, pixel size, binning, reducer, mount class.
The rig is the part that makes the numbers mean something. Once Ephemeris knows you're imaging at 0.40 arcseconds per pixel rather than 3, a 0.6″ night stops being a number and starts being a comparison. You get median, p75 and p90 across the range instead of one figure, total integration, and target clusters that group sessions pointing at the same patch of sky, so you can see how the same object guided in February and again in April.
Observations
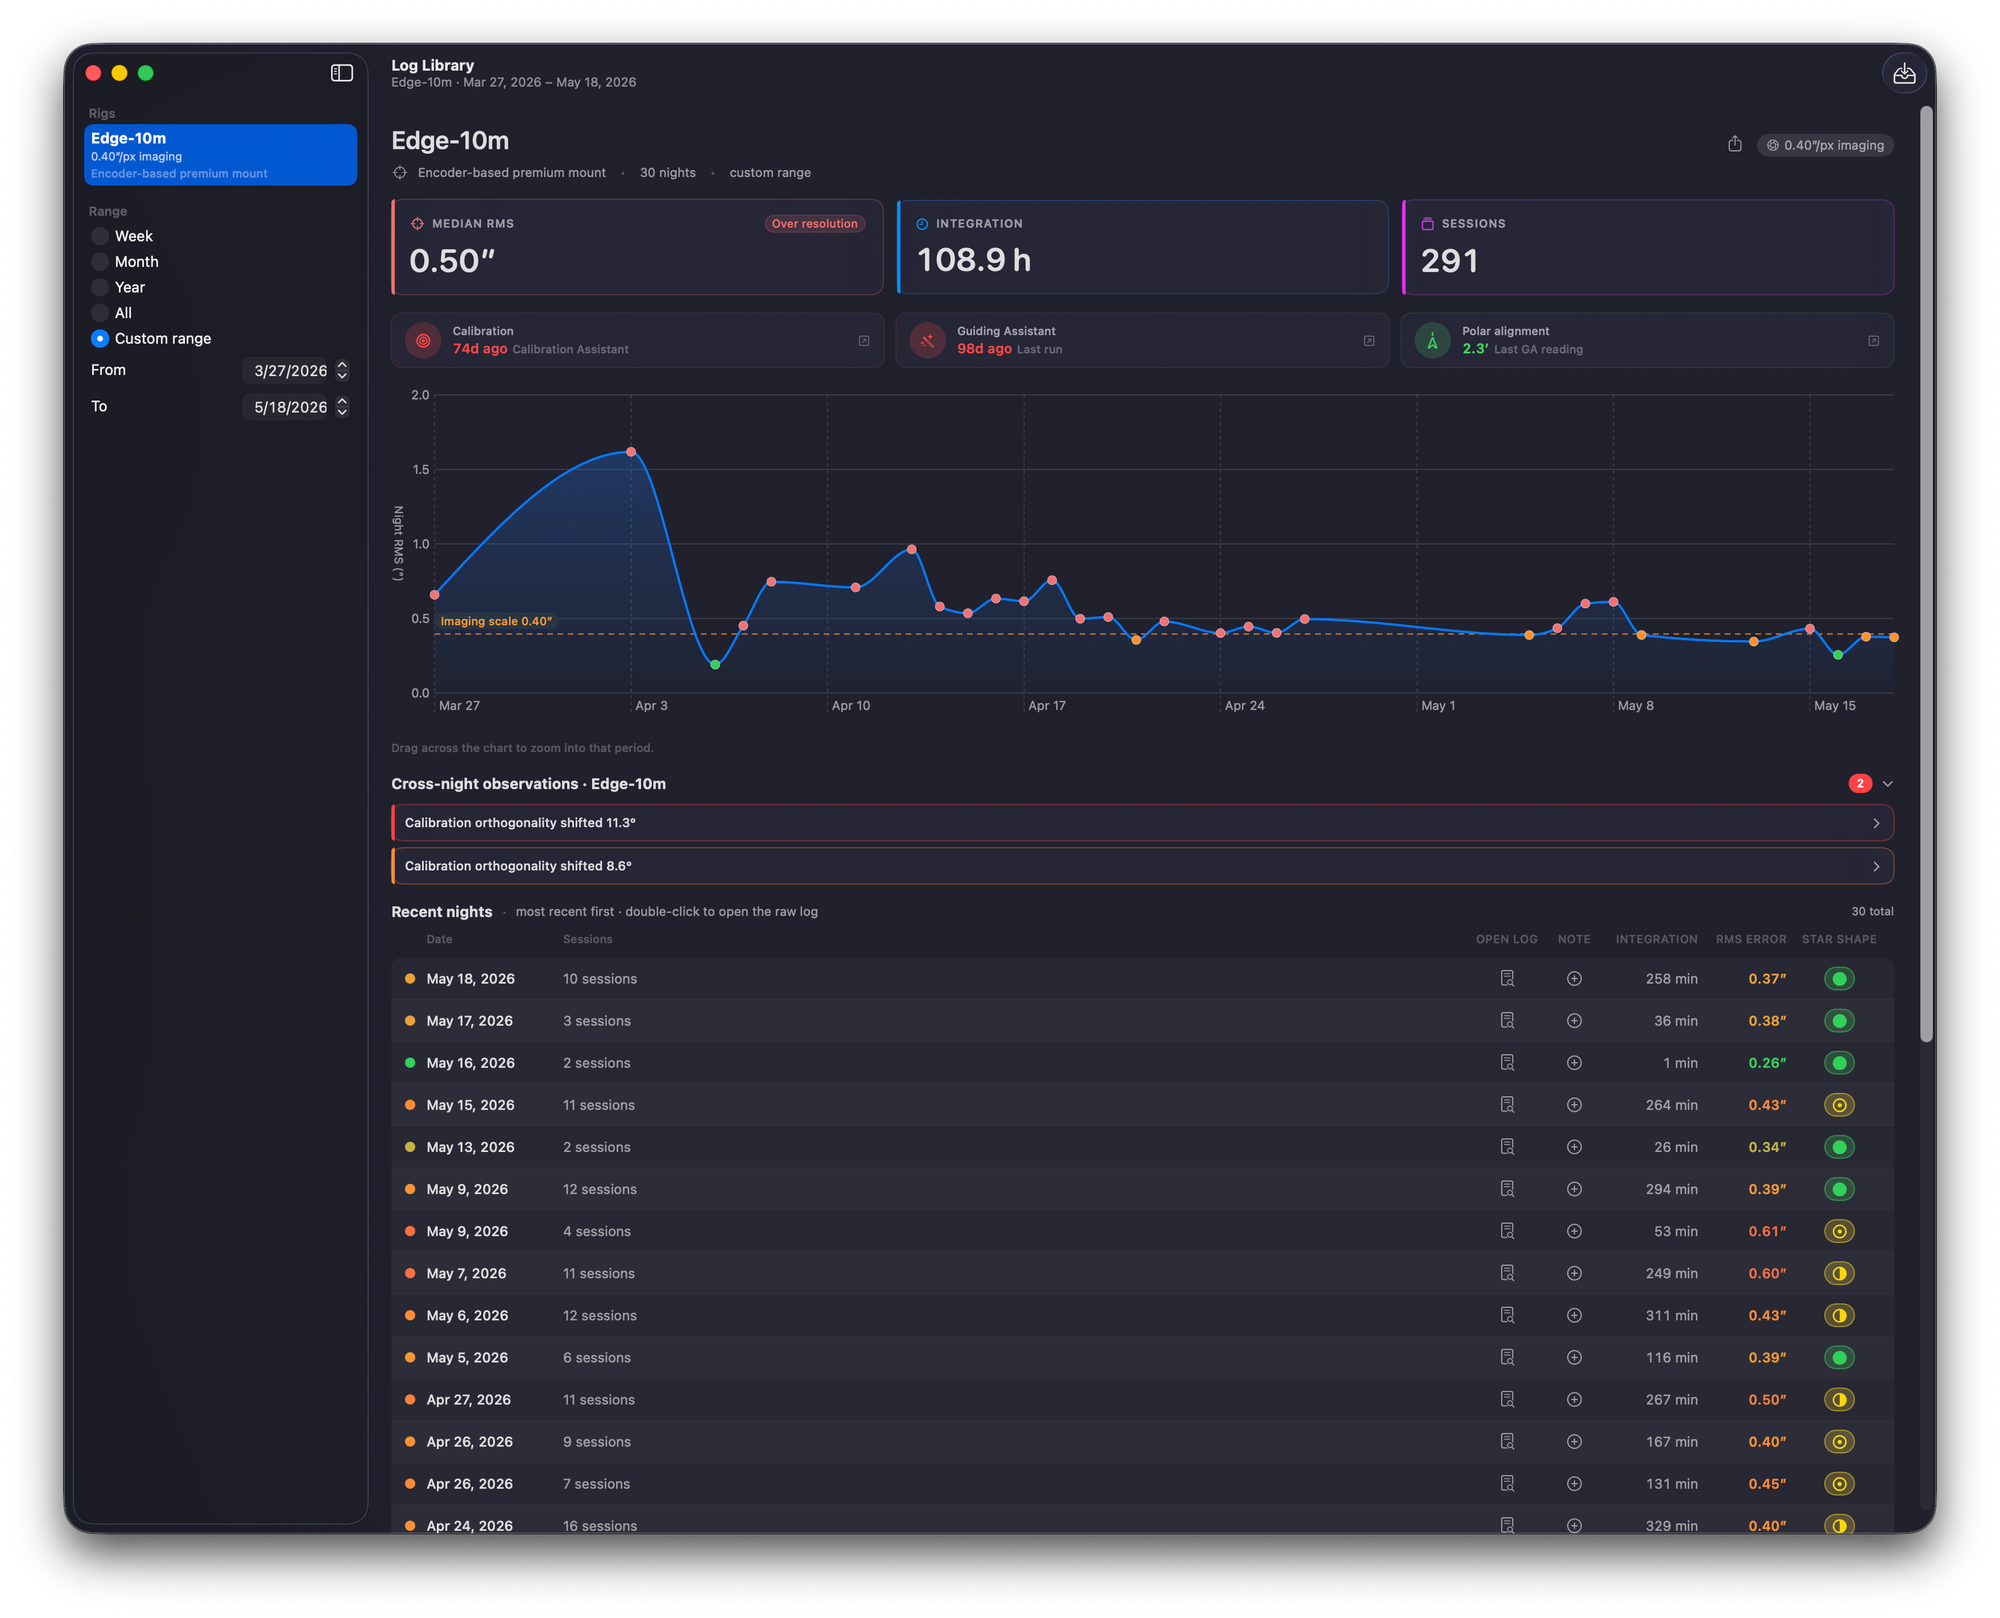
23 analysis rules run over your library, 19 within a night and 4 across nights, and write what they notice in plain language. Every one is labelled with where the claim came from.
That labelling is the part I care most about. An observation sourced to PHD2's documentation is applying a threshold from PHD2's own manual. One sourced to a PHD2 measurement is surfacing a number PHD2 produced, usually from a Guiding Assistant run, without deriving anything from it. One sourced to an Ephemeris heuristic is my inference from your data, which is useful and is not authoritative. When those disagree, and they do disagree, you can see which is which and make the call yourself.
Observations point at PHD2's own tools by name, because that's where the fix happens: the Calibration Assistant, the Guiding Assistant, Drift Align. And they stop short of claiming causation. A pier-side RMS ratio of 2.2x is a fact about your night. Why it happened is a hypothesis, and it gets written as one.
Annotations and star quality ratings
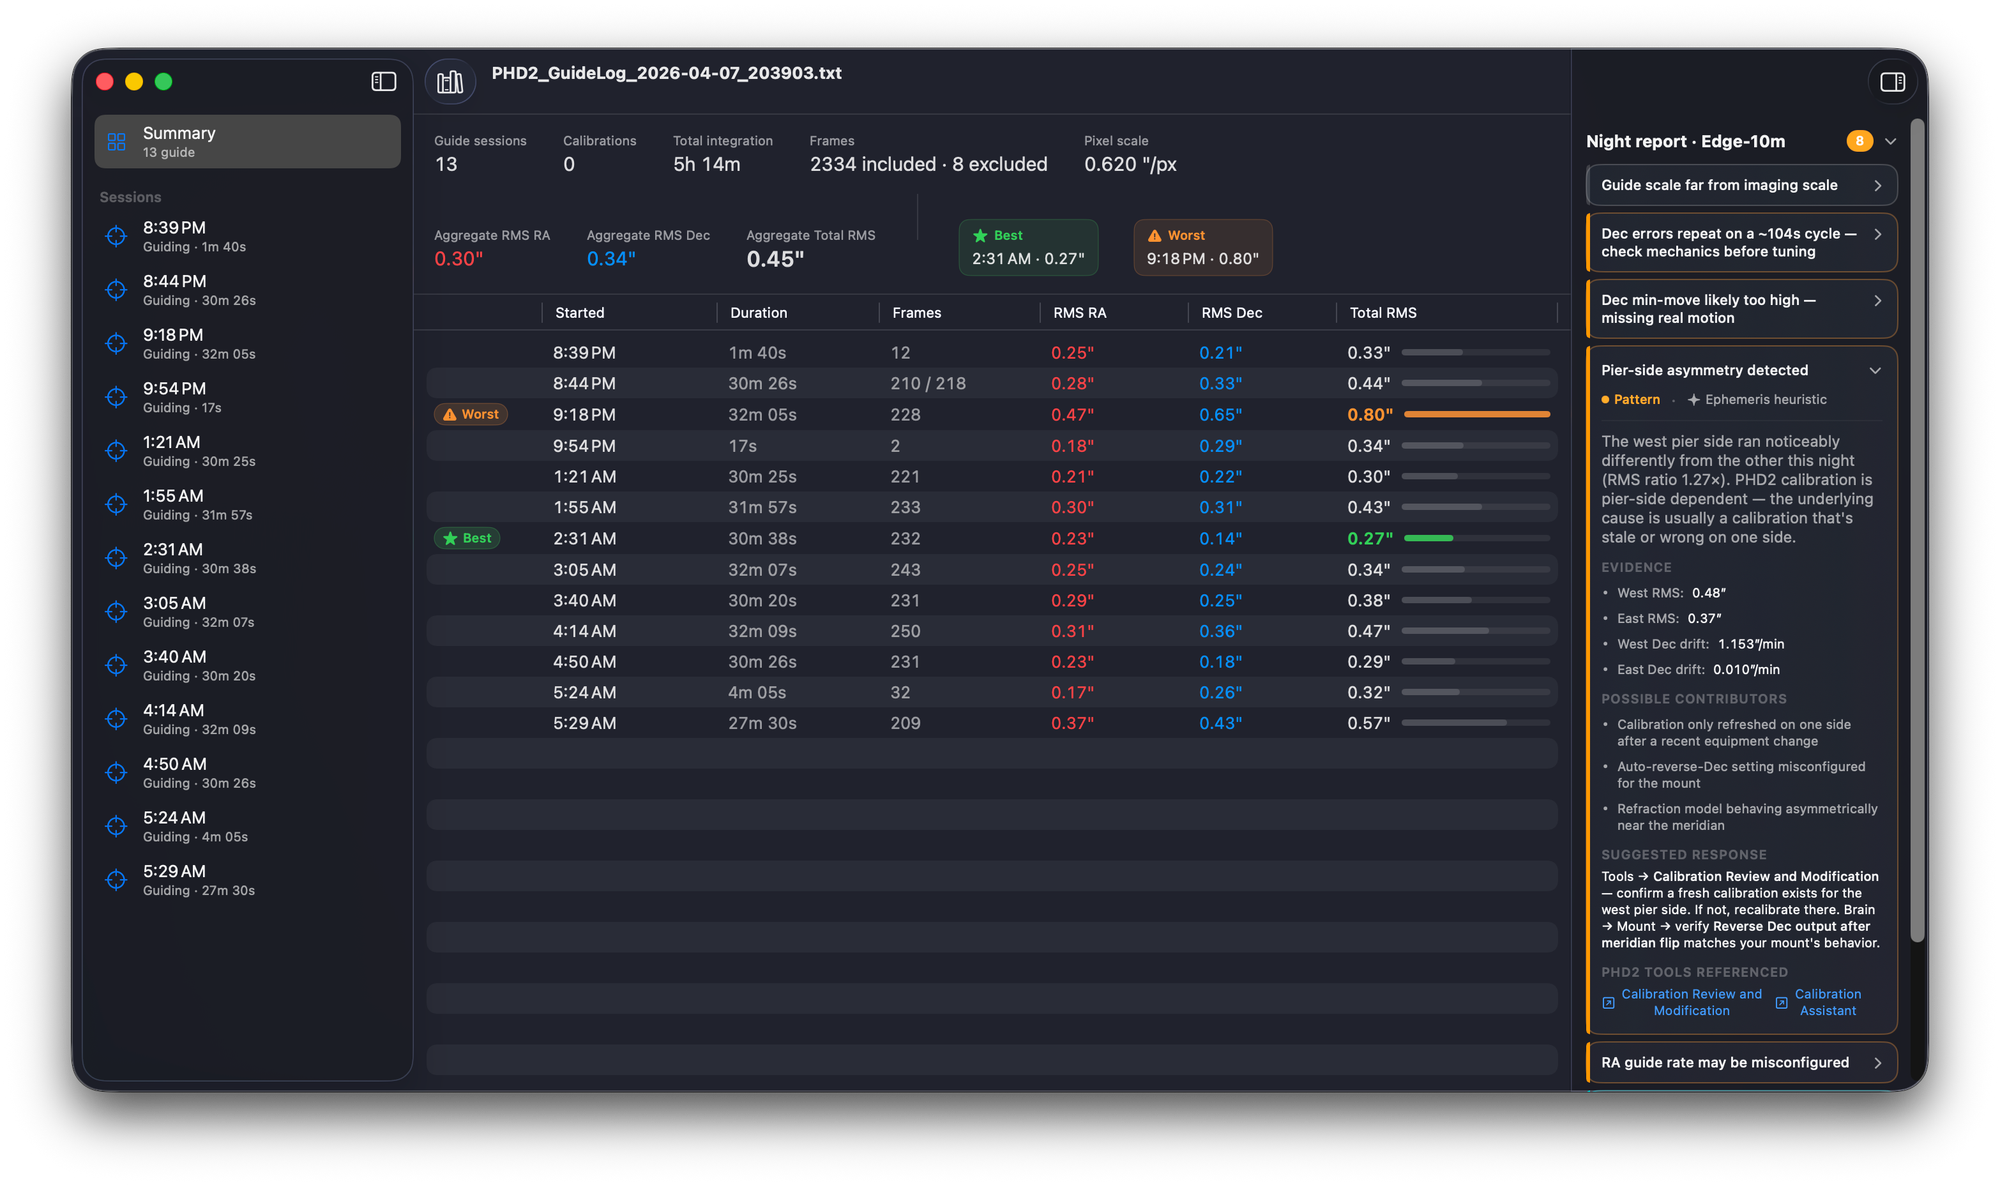
Record what you changed and when. A new guide camera, a re-greased worm, a night the wind never stopped. The cross-night rules use those notes to attribute step changes in your trends instead of guessing at them. Star quality ratings stay with a session, so "the good nights" becomes something you can sort by months later rather than something you half remember.
Asking your own logs questions
This one started with me pasting chunks of guide log into Claude by hand to argue about a night that had gone sideways. It worked better than it deserved to, so I built the app a way to hand over structured data instead of me copying text.
Turn on the MCP server in Settings and Claude Desktop, running on the same Mac, can query your library directly. It's read-only, it binds to loopback, it's off until you switch it on, and it exposes session-level summaries rather than raw frames or log text.
| |||||||||||||
| A real exchange against a real library: 56 nights, 291 hours, one rig at 0.40″/px. Ephemeris hands over the numbers and their provenance. It doesn't hand over an answer. |
Smaller things
Forum post export formats a session as text ready to paste into a Cloudy Nights thread, so asking for help stops meaning screenshotting a chart. Shortcuts support means importing a night or pulling stats can run from a shortcut or a Focus trigger. And the app now carries Sparkle, so future updates arrive in-app after you've said yes to checking for them.
Before you download
2.0 requires macOS 15 Sequoia. 1.0 ran on Sonoma, so if you're still on 14 this one won't open.
This update is manual. 1.0 shipped without Sparkle, so there's nothing in your current copy that can fetch the new one. Download it and replace the old app. It's the last time you'll have to do that.
Free, GPLv3, Developer ID signed and notarized, same as it was. Ephemeris is a Mac-native re-implementation of Andy Galasso's phdlogview, and it exists because that project does.
Download Ephemeris 2.0 · Read the full feature rundown · Source on GitHub