ih-FEM-uh-riss — Read your PHD2 guide logs natively on your Mac
Ephemeris is a Mac-native viewer for PHD2 guide logs — the text files PHD2 generates during every autoguiding session. The name is borrowed from astronomy itself: an ephemeris, from the Greek for "daily," is a table of celestial positions recorded over time — exactly what a PHD2 guide log is, frame by frame, all night. The app indexes every guiding and calibration section in the file, charts RA and Dec error in real time, runs FFT analysis on the guide signal to surface periodic error, and exports session statistics as CSV. Free, GPLv3, written in Swift and SwiftUI. A native Mac re-implementation of Andy Galasso's phdlogview — the canonical PHD2 log viewer, written and maintained by the same engineer who maintains PHD2 itself. I've spent more cumulative hours in phdlogview than any other piece of astronomy software, and Ephemeris exists because it does.
Every Session at a Glance
What does my whole night of guiding actually look like?
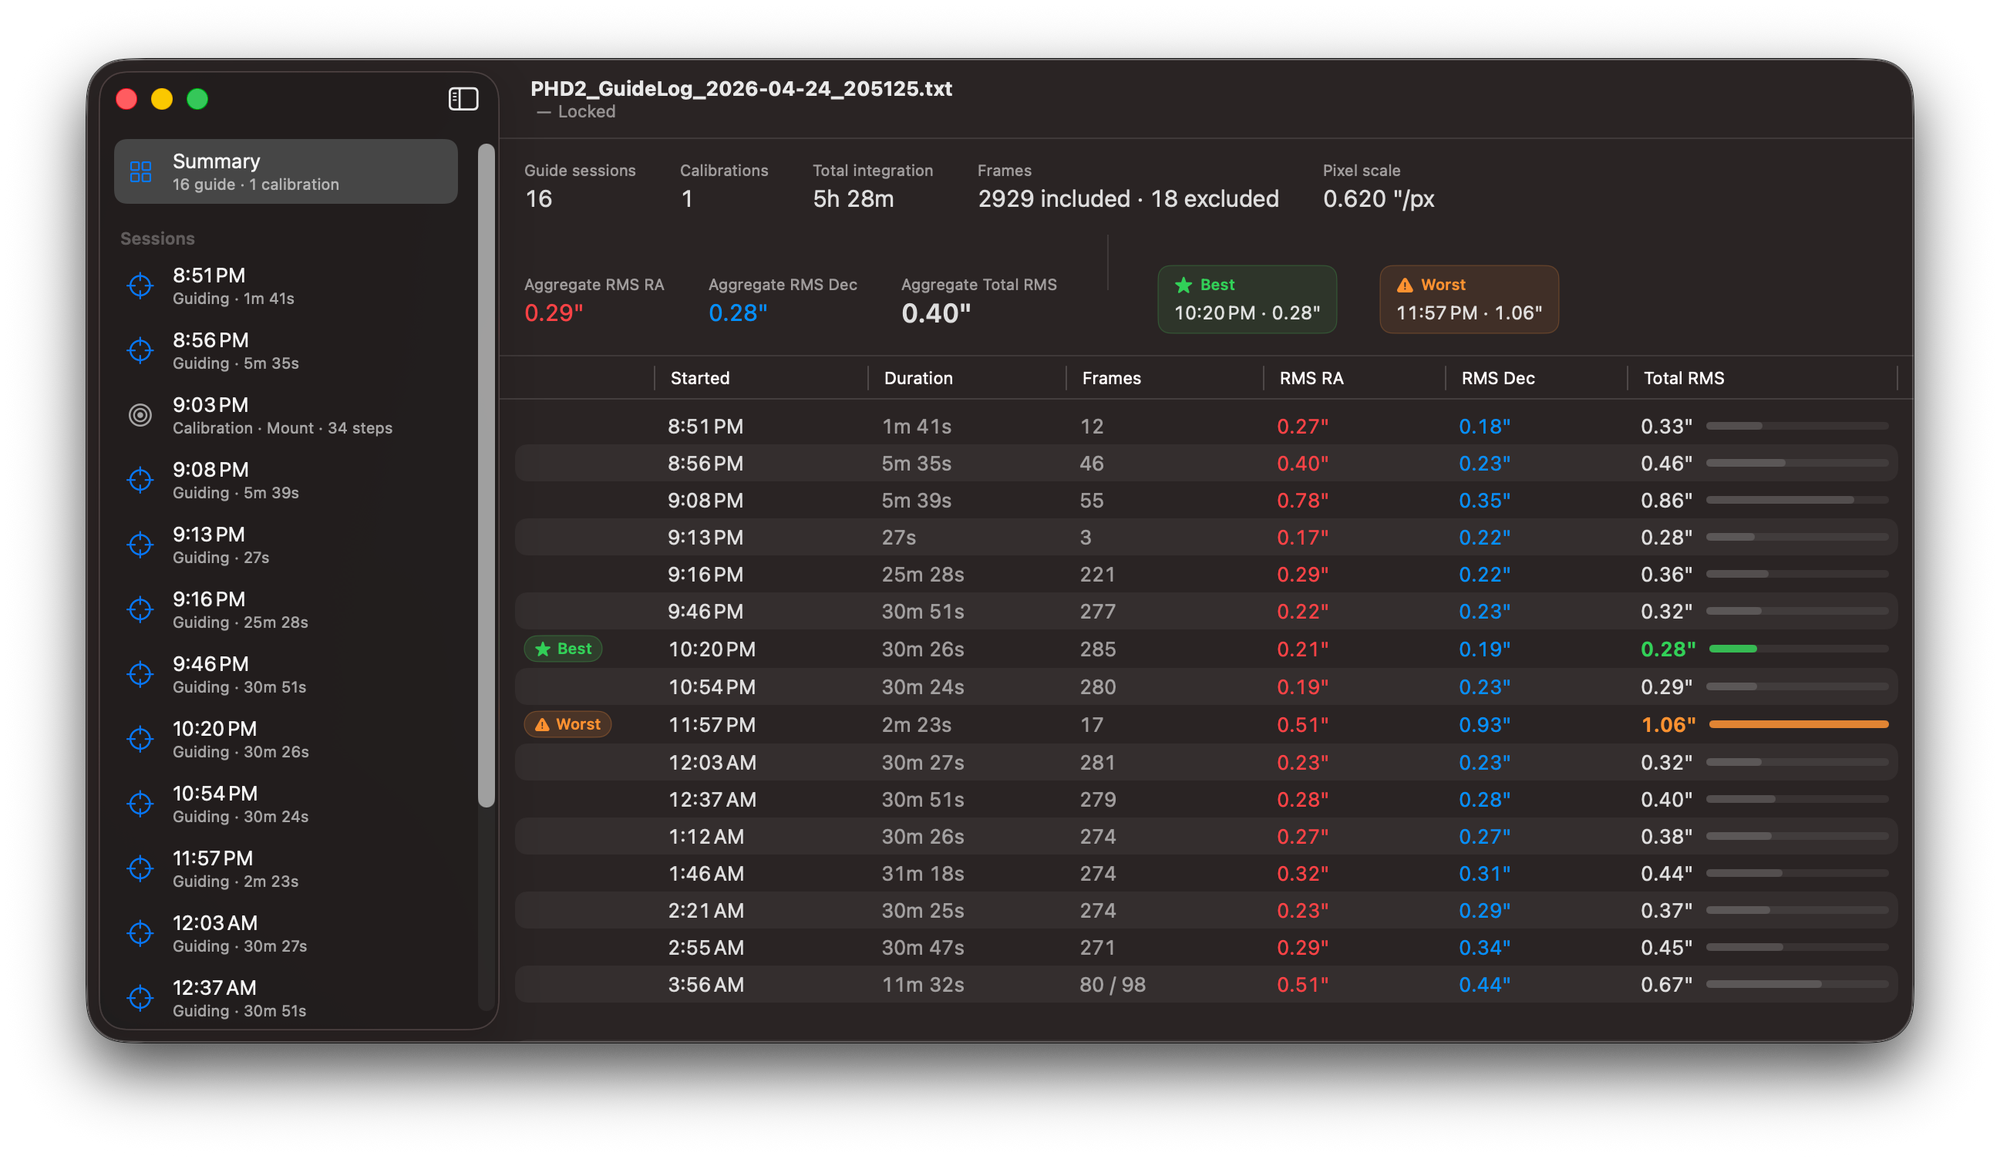
If you image for more than an hour or two, you don't have one guide log per night — you have fifteen. Meridian flips, dither pauses, settling resets, the time PHD2 lost the star and you didn't notice for ten minutes. Ephemeris reads the whole file at once and gives you every guiding and calibration section in chronological order, with RMS RA, RMS Dec, total RMS, and a quality bar that tells you instantly which sessions held up and which fell apart. The night's best session gets a green ★ chip. The worst gets an orange ⚠︎. Click into either to see exactly why.
Guiding Quality
Why was that one frame so much worse than the others?
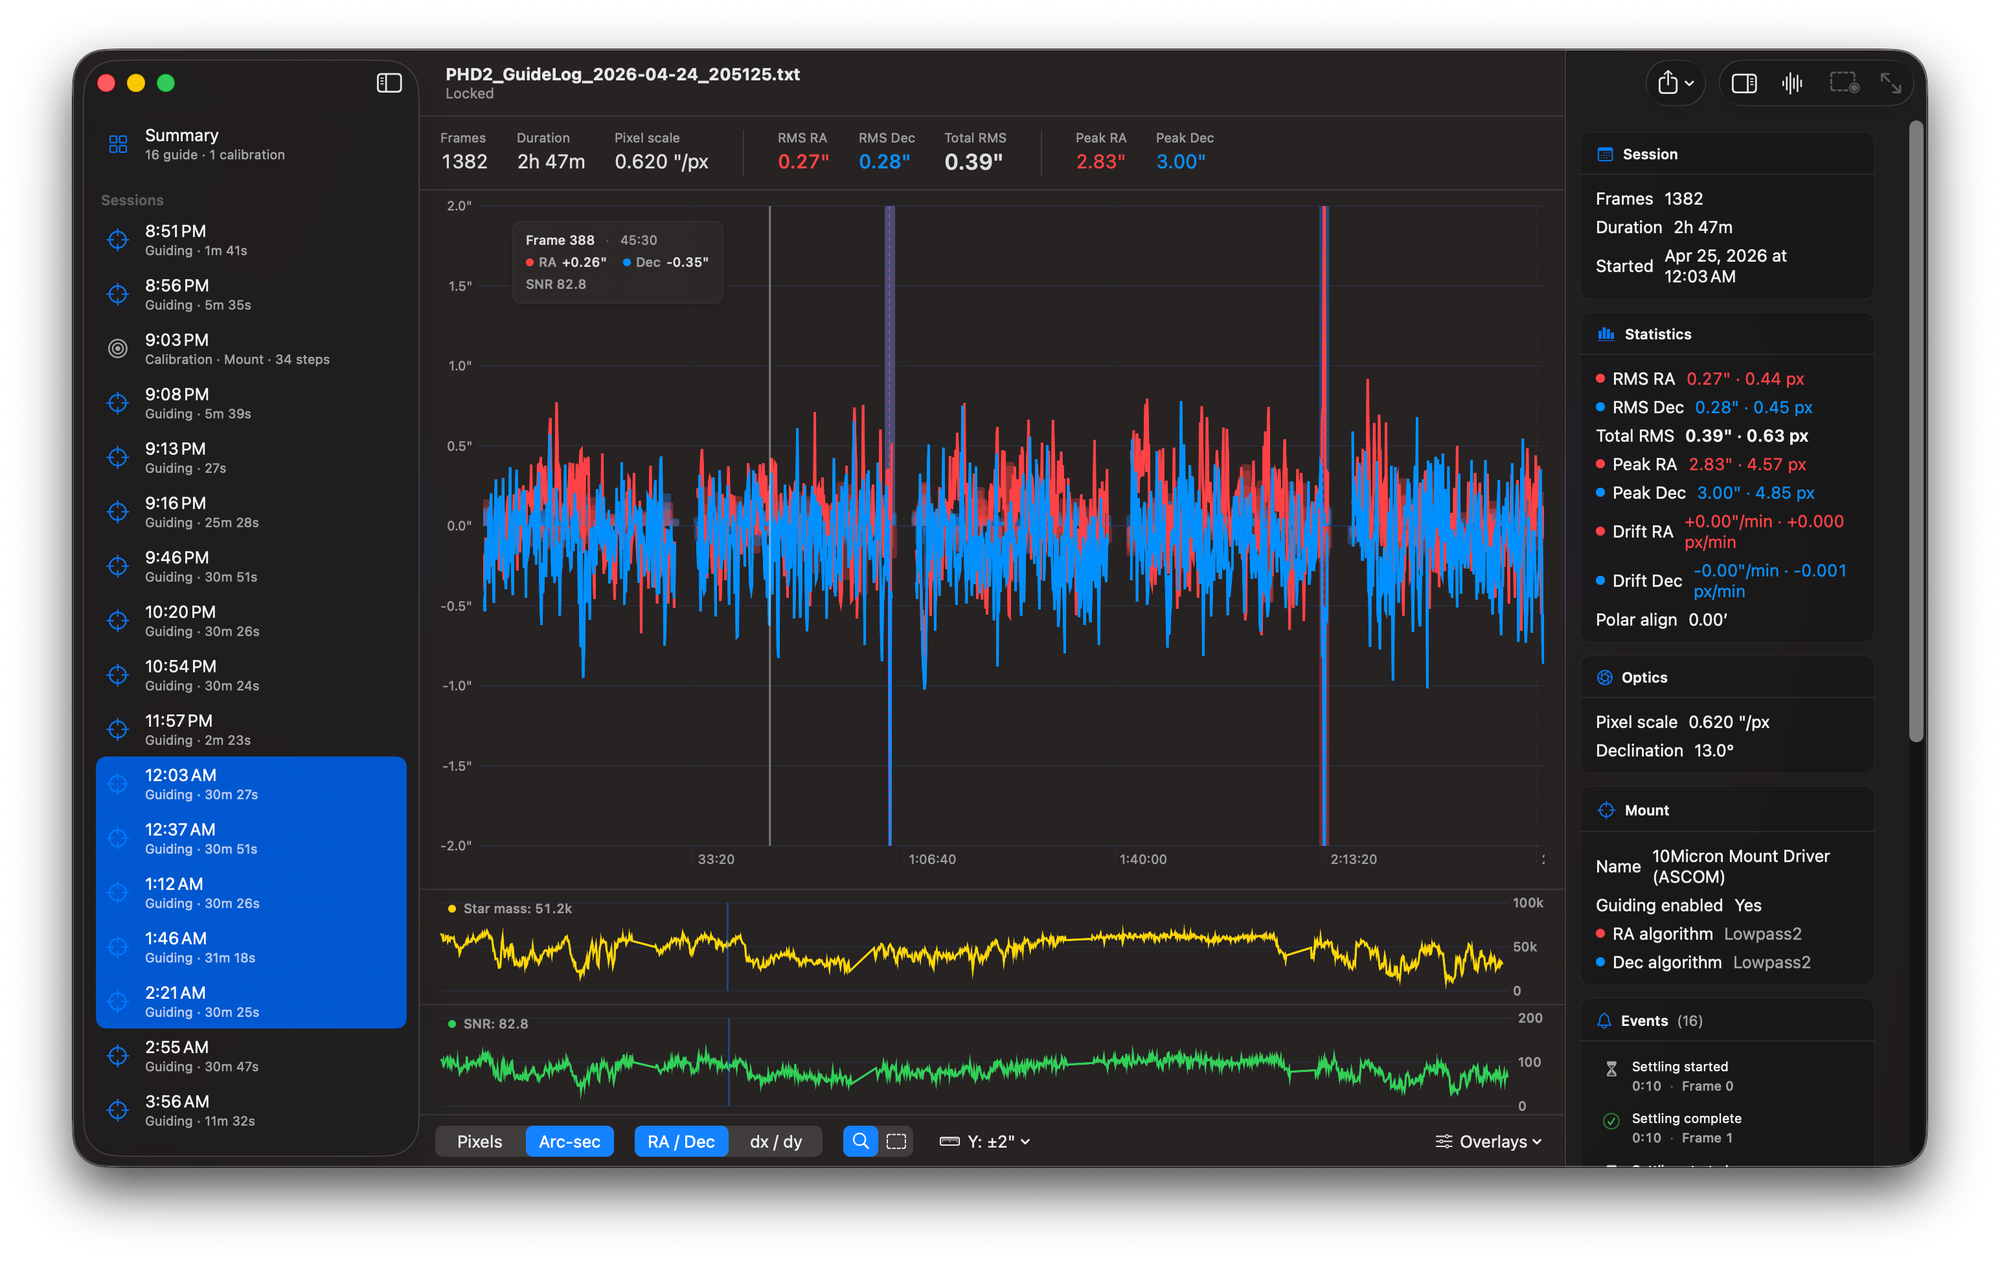
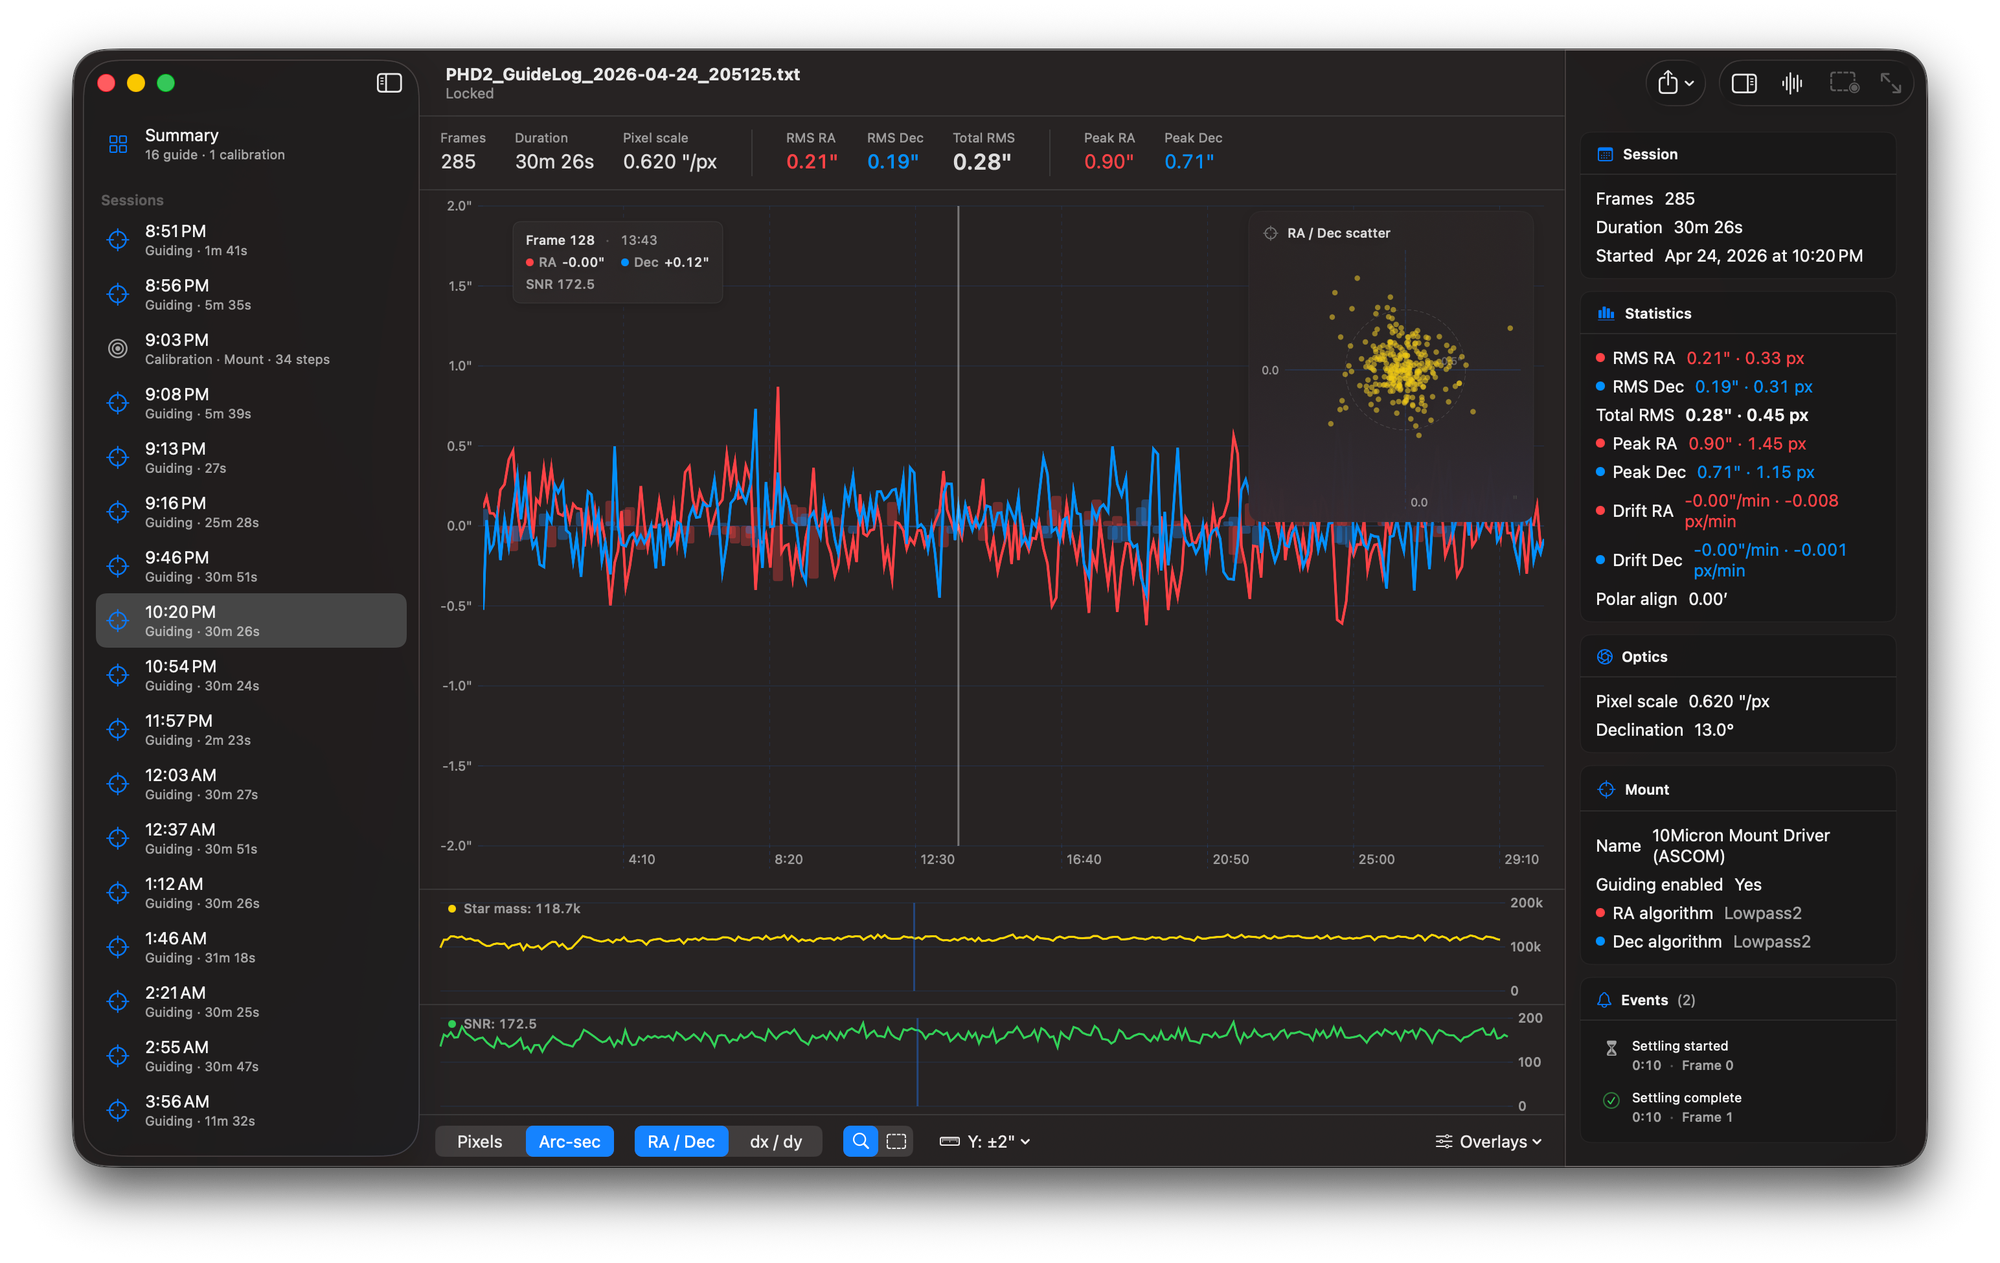
Drag horizontally on the chart to zoom into a spike. Switch the toolbar mode and drag to exclude a range instead — frames you know were bad (clouds, dew, a stray cable tug) drop out of the stats and the numbers recompute live. Settling bands appear as faint orange when settling failed and neutral grey when it succeeded — useful for telling apart "PHD2 lost the star and recovered" from "the dither went sideways and the next 30 frames were trash." Star mass and SNR are graphed beneath the main chart, both synced to the same hover position so you can answer the most common diagnostic question — was the star getting fainter, or was the seeing falling apart? — at a glance. Toggle pixels vs arc-seconds. Toggle RA/Dec vs raw dx/dy. The Y-axis snaps to ±0.5″, ±1″, ±2″, ±5″, ±10″, or auto.
Mount Calibration
Is my calibration actually any good?
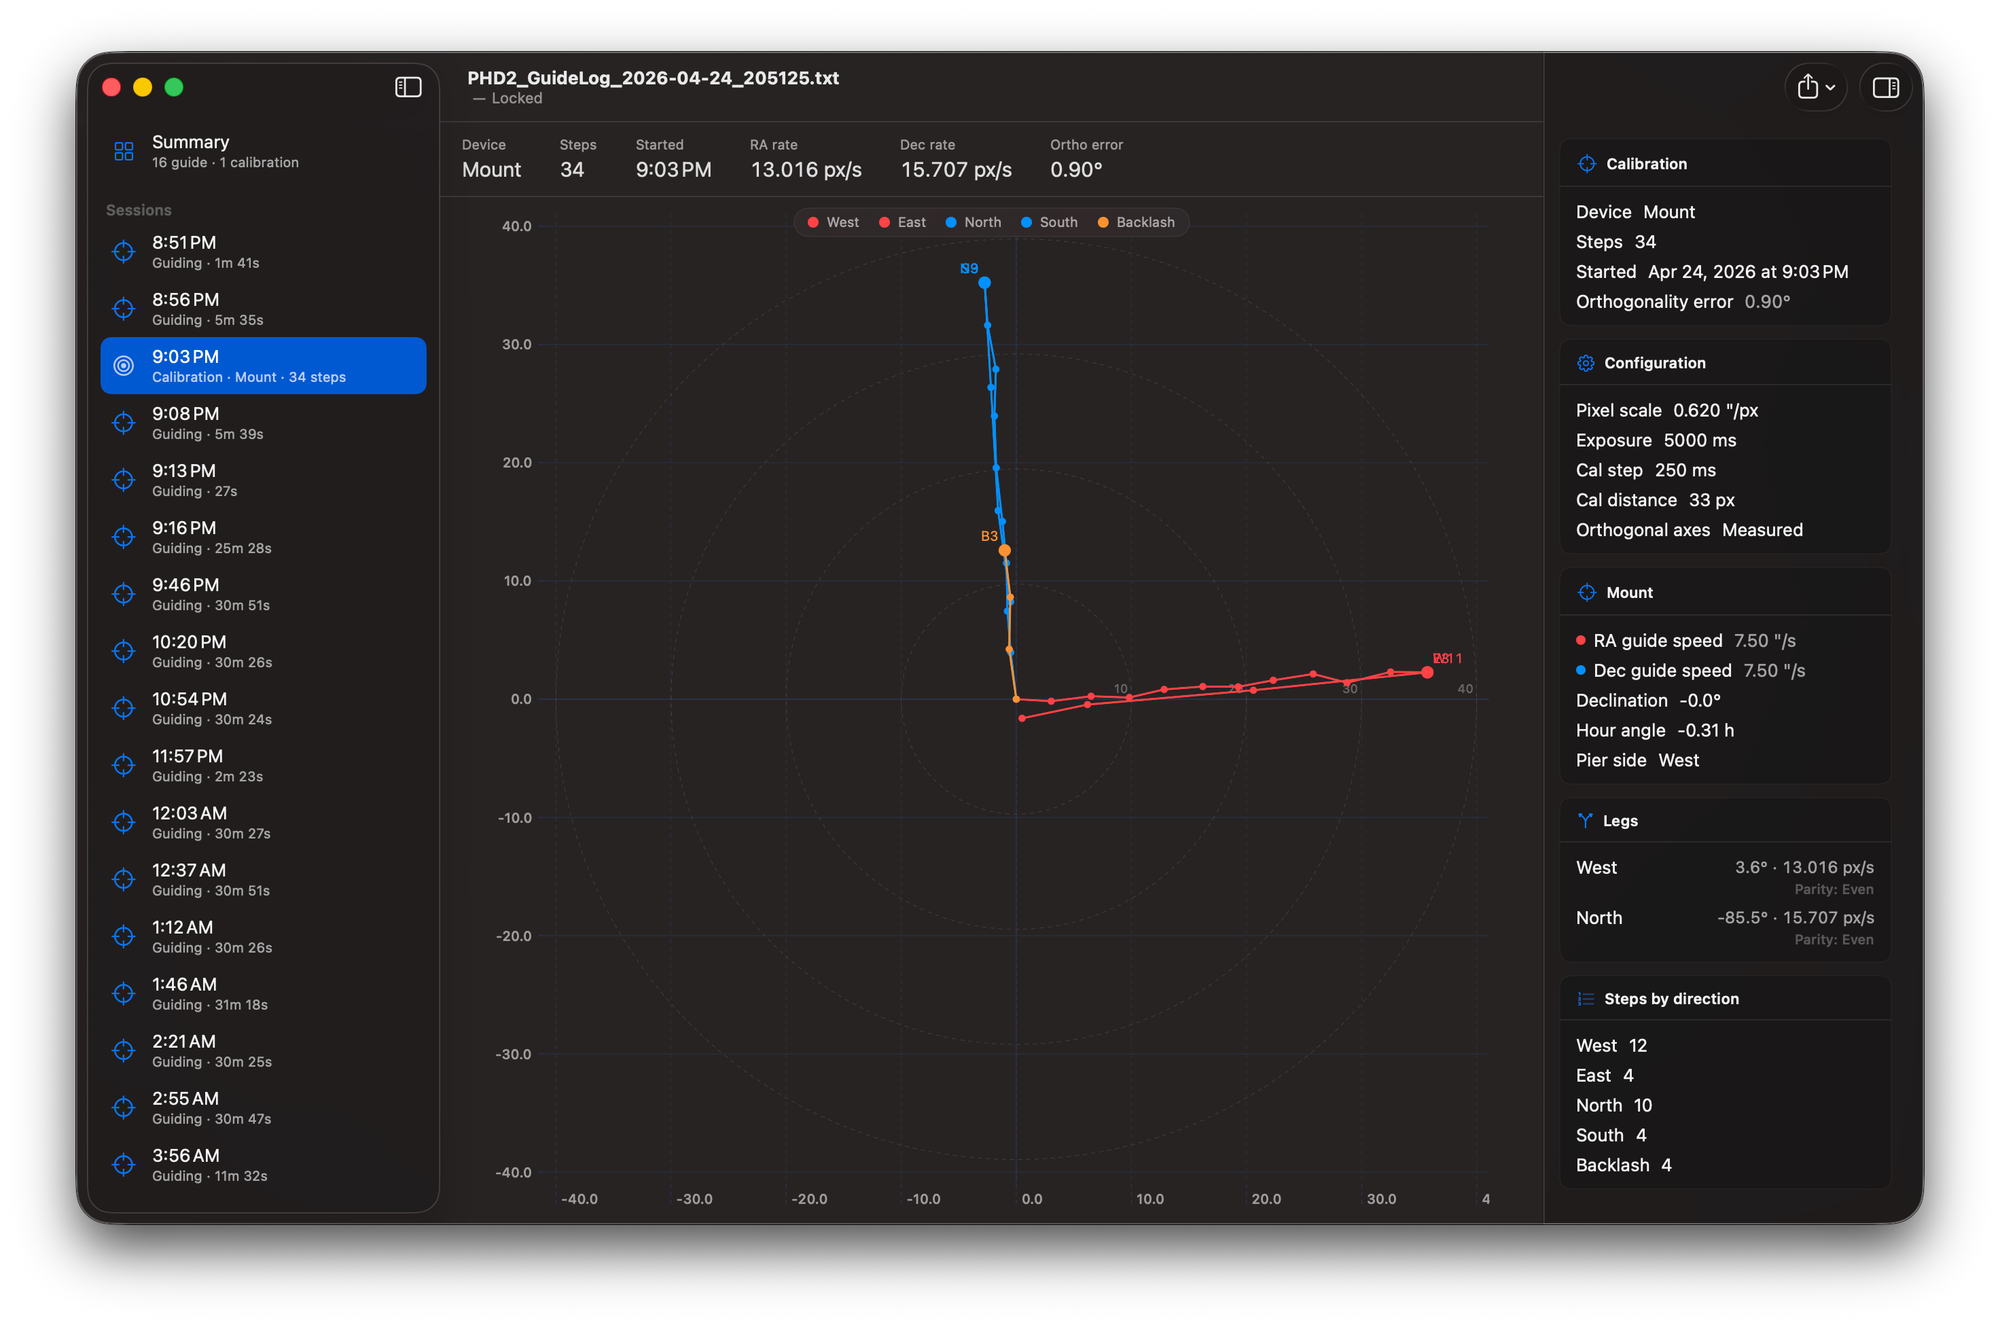
A clean calibration cross looks like a T. West and East run along one axis in red, North and South run perpendicular in blue, and Backlash steps trail off in orange before the Dec leg starts. Ephemeris draws yours with a 1:1 aspect ratio, dashed concentric reference rings, and tells you the orthogonality error in degrees — the angular distance between the West and North legs minus 90°. Anything past 5° gets flagged in orange. Below 1° is what you want on a well-aligned mount with measured (not assumed) orthogonal axes. The header strip pulls out the RA rate, Dec rate, exposure, calibration step, calibration distance, declination, hour angle, and pier side — every value PHD2 used to build the calibration, surfaced in one row instead of buried in the log header.
Periodic Error Analysis
What's that periodic spike in my guiding?
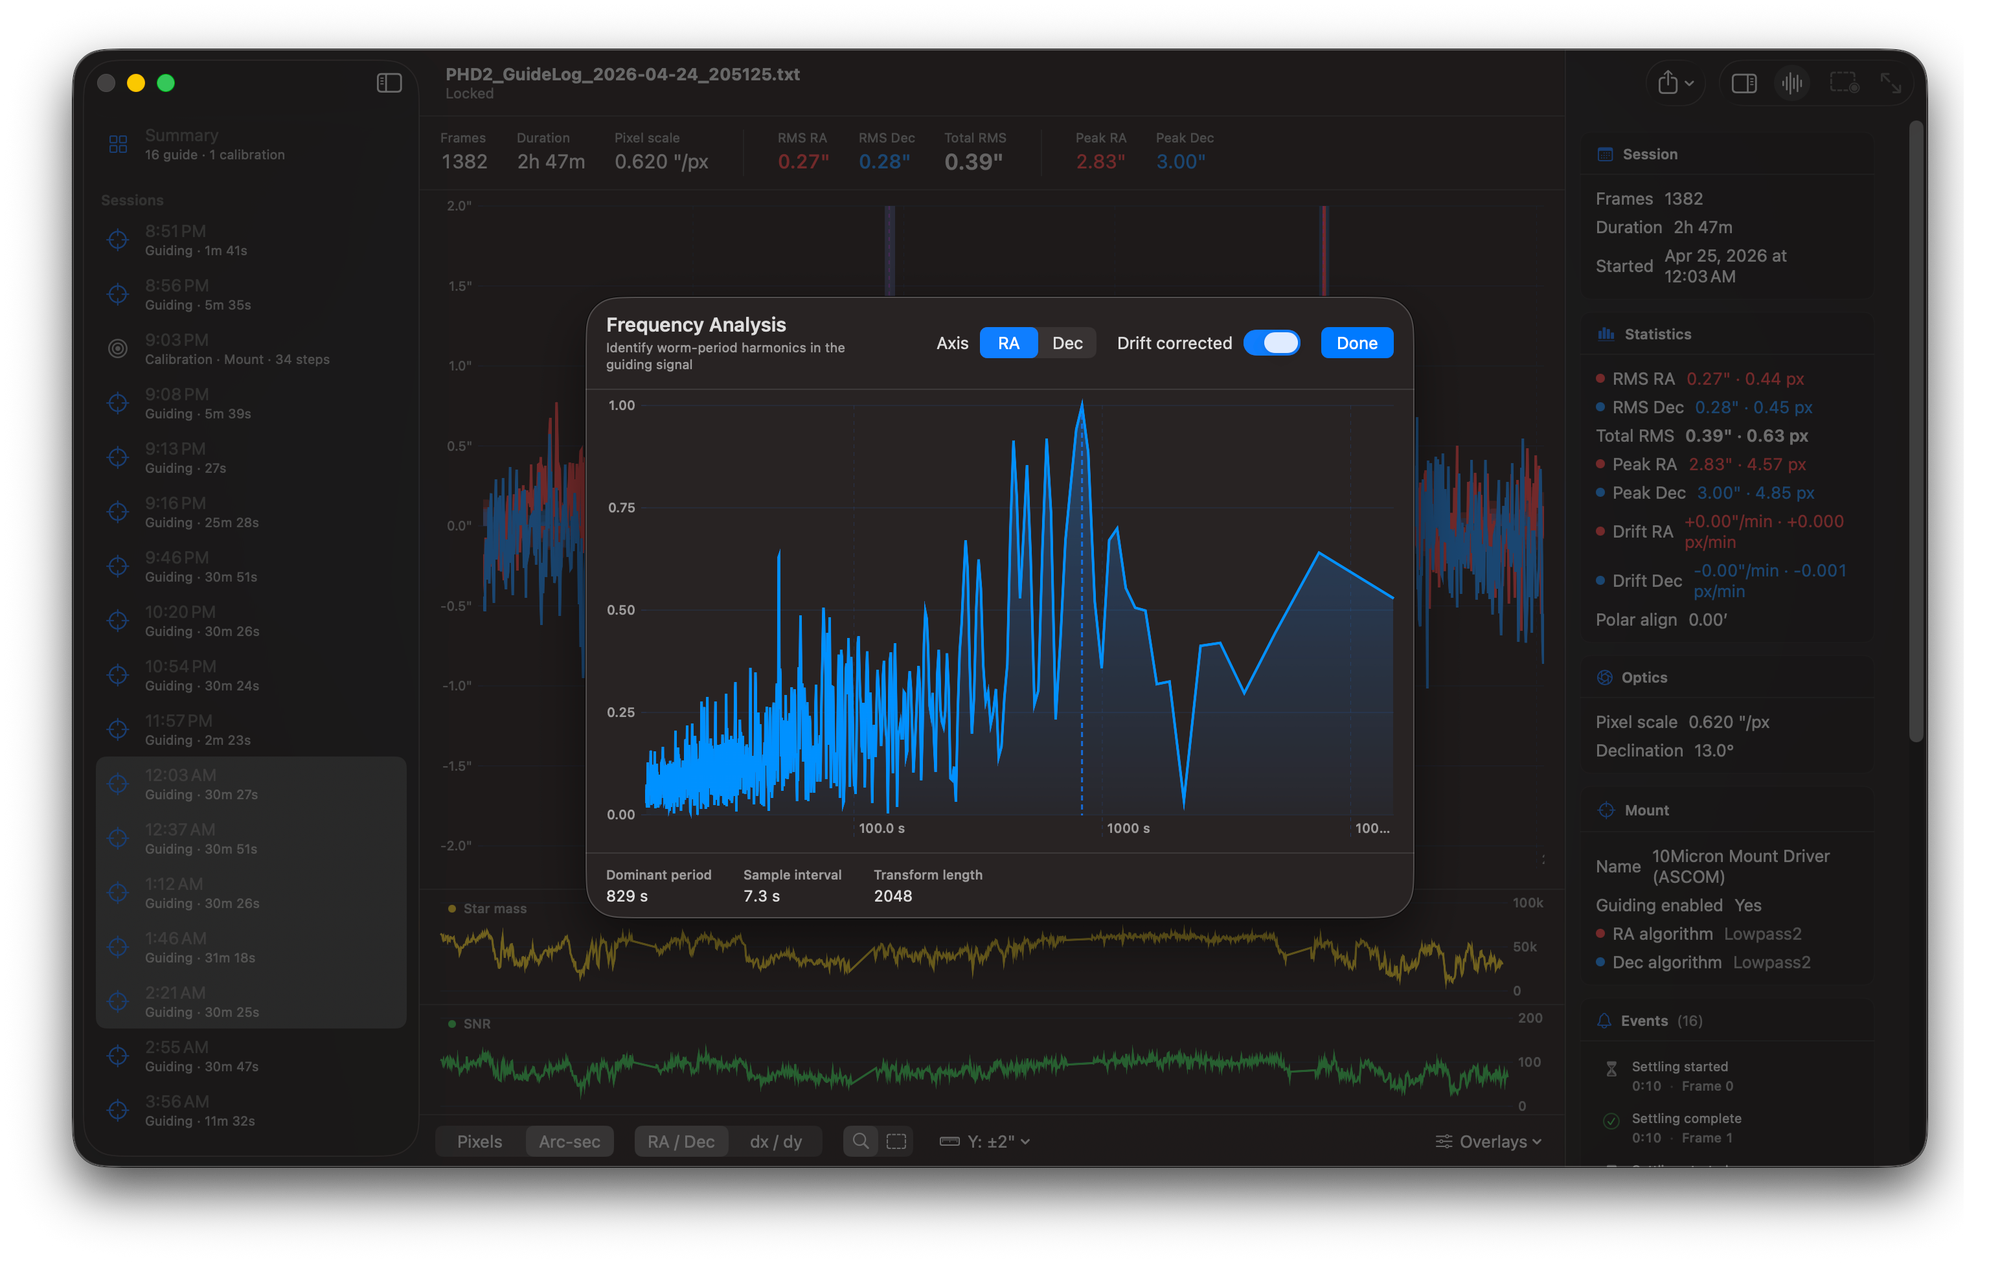
The FFT periodogram is the answer to "what's that periodic spike in my guiding?" Open the modal with ⌘F, pick RA or Dec, and Ephemeris runs a Hann-windowed real FFT on the included frames using Apple's Accelerate framework — the math runs in milliseconds even on a 30,000-frame combined session. The dominant period gets called out at the bottom. On a typical EQ-class mount that period is almost always the worm gear: an SkyWatcher EQ6 lands around 478 seconds, an HEQ5 around 638 seconds, a CGEM around 1436 seconds. On a high-end direct-drive or absolute-encoder mount, the dominant period is much harder to find because there isn't a worm. Drift correction is on by default (otherwise low-frequency drift swamps everything). Toggle it off to see what the raw signal looks like.
Built for the Mac
What's the point of a native rewrite when phdlogview already runs on the Mac?
Andy Galasso ships phdlogview for Windows, Linux, and macOS, and has for years. The current macOS download is an Intel binary built with the wxWidgets cross-platform UI toolkit, and on Apple Silicon it runs translated through Rosetta. That binary works, and on a lot of Macs it's the easiest answer.
Ephemeris takes a different path to the same destination. It's a Mac-native rewrite in Swift and SwiftUI, shipped as a universal binary that runs natively on both Apple Silicon and Intel — no translation layer, no cross-platform UI toolkit between you and the data. It uses Apple's design language, system menus, drag-and-drop, sandboxed file access, and the Apple Help system. Two valid paths. Andy's is the cross-platform original. Ephemeris is the version that pretends nothing else exists but the Mac.
-
Swift & SwiftUI
Not a port, not a wrapper. Apple's own UI frameworks throughout, written from scratch for the Mac.
-
Universal Binary
One download, native code paths for Apple Silicon and Intel. No Rosetta on M-series Macs.
-
Apple Accelerate
Real-FFT periodogram via vDSP — Apple's vectorized math library — instead of GSL. Milliseconds even on 30,000-frame sessions.
-
Swift Charts
Apple's first-party charting framework powers every plot in the app — time series, calibration, FFT, scatter.
-
Apple Help Book
Searchable, in-app help. Press ⌘? to open. Indexed by hiutil and integrated with macOS Help Viewer.
-
Sparkle Updates
Auto-updates the way every notarized macOS app should — signed appcast, EdDSA-verified, no App Store required.
-
Notarized Direct Download
Distributed direct from
macobservatory.combecause GPLv3 and Mac App Store terms are fundamentally incompatible. Same notarization, same hardened runtime. -
Sandboxed
App Sandbox enabled. Reads only the files you explicitly drop or open. No network calls, no telemetry, no analytics.
-
Open Source
GPLv3 on GitHub, the same license as upstream
phdlogview. Read the code, file an issue, send a pull request.
Everything Else
The rest of what Ephemeris does.
Beyond the chart, calibration plot, and FFT, the things you'll reach for on a long imaging night.
Multi-Session Combining
Multi-select sessions in the sidebar to view as one virtual log. Real wall-clock gaps are preserved — meridian flips and cloud breaks show as flat sections instead of straight lines that lie about your data.
Manual Frame Exclusion
Drag any time range to exclude it from stats. Cable tugs, gusts, dew. The numbers recompute live and the scatter overlay redraws.
Hover & Pin Selection
Click any frame to anchor a rule. The Inspector follows. Star mass and SNR sub-charts sync to the same position. Stays pinned while you scrub.
Bordered Inspector Cards
Right-pane inspector with cards for Session, Statistics, Optics, Mount, AO, and Events. Click any event to jump the chart to that frame.
Polar Alignment Estimate
Ephemeris computes a König-formula polar-alignment estimate from your Dec drift and declination. Suppressed near the celestial pole where the math gets unstable.
CSV & PNG Export
Three CSV exports — session stats, frame data, full log summary — and the chart as PNG at 2× retina. Delivered through the system share sheet.
In-App Apple Help
Searchable Help Book with nine topic pages — getting started, reading the chart, statistics, zoom and exclusions, calibration, FFT, exporting. Press ⌘?.
Drag & Drop
Drop a .txt log on the Dock or app icon and Ephemeris opens it read-only. Tolerates Windows CRLF and clock-jump artifacts in PHD2 logs.
Sortable Summary Table
Every guide session in one table — Started, Duration, Frames, RMS RA, RMS Dec, Total RMS — sortable by any column, with quality bars and Best/Worst chips.
How Ephemeris Compares
How is this different from phdlogview?
Three tools read PHD2 guide logs: Ephemeris (Mac-native, this page), phdlogview (the canonical viewer by Andy Galasso, available for Windows, Linux, and macOS), and PHD2's built-in log viewer (functional but minimal, embedded in PHD2 itself).
A note before the table: phdlogview is the upstream original, written and maintained by Andy Galasso — the same engineer who maintains PHD2 itself. Ephemeris exists because phdlogview exists. The comparison below isn't a competition; it's a "where does each tool fit" guide for Mac users specifically. On Windows, Linux, or Intel Macs, phdlogview is a fully supported and well-maintained tool.
| Capability | Ephemeris | phdlogview | PHD2 built-in |
|---|---|---|---|
| Native Mac UX | ✓ Liquid Glass, drag-and-drop, native menus | ~ wxWidgets cross-platform UI toolkit | ~ Embedded in PHD2's UI |
| Apple Silicon native | ✓ Universal binary | ~ Intel binary, runs via Rosetta on Apple Silicon | ~ Intel binary via Rosetta |
| Time-series chart with hover/pin | ✓ | ✓ | ✓ |
| Drag-to-zoom & drag-to-exclude | ✓ | ✓ | — |
| Calibration XY plot | ✓ With orthogonality readout | ✓ | ~ Basic |
| FFT periodogram | ✓ Hann + Apple Accelerate | ✓ Hamming + GSL | — |
| Multi-session combining (gaps preserved) | ✓ Real wall-clock gaps | ✓ | — |
| CSV & PNG export | ✓ Three CSVs + chart PNG | ✓ | — |
| In-app Apple Help | ✓ Searchable, indexed | — | — |
| Open source | ✓ GPLv3 | ✓ GPLv3 | ✓ BSD |
| Free | ✓ | ✓ | ✓ |
| Platform | macOS 14+ | Windows / Linux / macOS (Intel only) | Wherever PHD2 runs |
phdlogview works on every platform PHD2 runs on, including macOS — Andy ships builds going back to Mojave. Ephemeris is the option for Mac users who specifically want Apple Silicon-native performance, the Liquid Glass design language, and Mac-idiomatic interactions like drag-and-drop and Apple Help. Both projects are GPLv3 and serve the same goal. Pick whichever fits your workflow.
Open Source
Free, with the door left open for support.
Two short stories — why this app is free, and how to chip in if it's saved you a frustrating night of debugging.
Why Ephemeris is free.
Ephemeris is a Mac-native re-implementation of phdlogview — the original PHD2 log viewer written by Andy Galasso, the same engineer who has maintained PHD2 itself for years. phdlogview is GPLv3, so any work derived from it is GPLv3 — that's how the license works, and it's correct. GPLv3 and Apple's Mac App Store license terms are fundamentally incompatible, so Ephemeris is distributed direct from this site. Same notarized, same secure, just not via the App Store.
Source on GitHub. License at gnu.org/licenses/gpl-3.0.
Support development.
If Ephemeris saves you a night of frustrated debugging, or helps you finally diagnose that worm-gear period you've been chasing, consider chipping in on Patreon. Your support pays for development time on this app, the next open-source utility, and the ongoing cost of running Mac Observatory. Patreon is optional. Ephemeris is and will remain free.
Become a SupporterDonating doesn't unlock features. There aren't any locked features.
Mac Observatory Suite
Built for the Mac. Built for Astronomers.
Native macOS apps filling the gaps the astronomy community has been waiting for.
The Observing Workflow Look Up → Capture → Process → Archive
It starts with Transit — live conditions and tonight's events tell you when the sky is worth it. Then the planetary workflow takes over: Laminar captures, Strata stacks and sharpens on the GPU, and Meridian catalogs every deep sky session automatically.
Guiding Diagnostics Free & Open Source
Swift & SwiftUI · Apple Silicon Native · Metal GPU · No Subscriptions
Ready to read your PHD2 logs natively?
Ephemeris 1.0 is available now. Download below, or grab the latest release directly from GitHub.
Free · GPLv3 · macOS 14 Sonoma or later
The questions deep-sky imagers actually ask about reading PHD2 guide logs, RMS, and what those numbers mean for your images.
What does total RMS actually tell me about my guiding quality?
Total RMS (root-mean-square) is the average size of your guiding error in pixels or arc-seconds, computed across every included frame in a session. It's a single number that summarizes how much your star wandered from the lock position during exposures. Lower is better, and it directly affects how much trailing or smearing shows up in your final integrated image — RMS bigger than the diameter of a star at your image scale will show as elongated stars. Ephemeris reports RMS RA and RMS Dec separately, plus the geometric total — that decomposition matters because the two axes fail in different ways.
What's a "good" total RMS number for my setup?
The honest answer is "it depends on your image scale." A total RMS of 1.0″ is fine on a wide-field rig at 3″/pixel, terrible on a long-focal-length rig at 0.5″/pixel. The general rule deep-sky imagers use: total RMS should be smaller than your image scale, and ideally smaller than half of it. So at 1.5″/pixel, you want total RMS under ~0.75″. At 0.5″/pixel, you need under ~0.25″. The Ephemeris stats strip shows your pixel scale right next to the RMS values so you can do this comparison without leaving the chart.
How does pixel scale change what good guiding looks like?
Pixel scale (arcseconds per pixel) is a function of your imaging camera's pixel size and your telescope's focal length. A short refractor with a small-pixel camera might run at 3″/pixel — the seeing limit is fundamentally above your pixel resolution and guiding errors of half an arc-second are invisible. A long-focal-length CDK with the same camera might run at 0.4″/pixel — now every guiding twitch is recorded and the same 0.5″ RMS that was invisible before is a star-elongation problem. Ephemeris doesn't decide what's good for you; it surfaces the pixel scale right alongside the RMS so you can make the call yourself.
Why does total RMS matter more than RA RMS or Dec RMS alone?
Because stars are points, not lines. If your RA RMS is 0.3″ and your Dec RMS is 0.2″, the total error is the geometric combination — about 0.36″ — and that's the radius of the smear circle your star paints on the sensor during an exposure. RA-only or Dec-only RMS is useful for diagnosing the cause of poor guiding (worm-gear period error shows up in RA, polar misalignment shows up in Dec drift), but for assessing your final image quality, total RMS is the number that matters.
How do I tell if my drift is polar alignment or mount tracking?
The signature is in the axis. Persistent Dec drift — a slow, monotonic line in the chart over many minutes — is almost always polar alignment. Mount tracking errors show up as RA periodicity (worm-gear cycles) plus possible random scatter. Ephemeris computes the König-formula polar-alignment estimate from your Dec drift and declination, displays it in arcminutes, and suppresses it near the celestial pole where the math becomes unstable. If your polar-align estimate is reading a few arcminutes after a session that was supposed to be well-aligned, your Dec drift is telling you something.
What does the FFT periodogram show that the chart doesn't?
The chart shows error as a function of time. The FFT shows error as a function of frequency. They surface different things. A worm-gear period of 478 seconds will show up in the chart as a slight repeating wave (often invisible in the noise) and in the FFT as a sharp spike at exactly 478 seconds. That spike is impossible to miss. The dominant period in the FFT is almost always your mount's worm — Ephemeris labels it for you in the modal — and once you know the period, you know which mechanical component to investigate. PEC training, gear regreasing, or replacement.
Why does orthogonality error matter, and what's an acceptable value?
Calibration measures how the mount's RA and Dec axes are oriented relative to the camera. If those axes aren't actually 90° apart in the calibration plot, PHD2's correction pulses won't move the star in clean RA and Dec directions — they'll have a cross-axis component that fights the guiding algorithm. Below 1° is excellent. 1–5° is fine. Above 5° is a flag, and Ephemeris colors it orange so you can't miss it. High orthogonality error usually means your mount's polar axis isn't level, your axes are mechanically misaligned, or the calibration ran while the star was being affected by something else (cable drag, dew building on the corrector).
How is Ephemeris different from phdlogview?
Functionally, they're close — same analyses, same answers. phdlogview is the canonical viewer, written and maintained by Andy Galasso (who also maintains PHD2 itself), and Andy ships builds for Windows, Linux, and macOS. The current Mac download is an Intel binary built with the wxWidgets cross-platform UI toolkit and GSL for math; on Apple Silicon it runs translated through Rosetta.
Ephemeris is a complementary Mac-native rewrite in Swift and SwiftUI, with Apple Accelerate for the FFT, a universal binary that runs natively on both Apple Silicon and Intel, the Liquid Glass design language, drag-and-drop, native menus, sandboxed file access, and Apple Help. Both projects are GPLv3 and aim at the same thing — helping you understand your guiding. Pick the one that fits your platform and your taste.
Why is Ephemeris GPLv3 and not on the Mac App Store?
phdlogview, the upstream codebase, is GPLv3. Any work derived from a GPLv3 project must also be GPLv3 — that's how the license is designed to work. The Mac App Store's licensing terms are fundamentally incompatible with GPLv3 (the App Store imposes additional restrictions on redistribution that GPLv3 explicitly forbids), so GPL'd apps cannot ship through the App Store. Direct distribution from macobservatory.com is the right answer for a GPL'd app — the binary is still notarized, hardened, and runs sandboxed.
Does donating to your Patreon get me anything extra?
No. There aren't any locked features in Ephemeris and there won't be — that would make the app non-free in spirit even if it remained free in license. The Patreon exists for people who want to support open-source work and help fund the next utility. Donating gets you the satisfaction of having paid for something you believed in. That's it.