Ephemeris is a free, native macOS app that reads PHD2 guide logs and turns them into something you can actually navigate — sortable session summaries, a time-series chart with drag-to-zoom, an FFT periodogram, calibration plots with orthogonality checks, and multi-session combining. It's GPL-3.0, available now from Mac Observatory, and built in Swift and SwiftUI from the ground up.

- Price: Free
- License: GPL-3.0 (source on GitHub)
- Platform: macOS 14 (Sonoma) or later, Apple Silicon native
- Distribution: Developer ID signed & notarized, direct from Mac Observatory
- Developer: Andrew Burwell / Mac Observatory
Why I Built It
PHD2 — the open-source autoguiding application by Bruce Waddington and Andy Galasso, and the de facto standard for amateur autoguiding on both Windows and Mac — already has a log viewer. It's called phdlogview, written by Andy himself, and it ships native Mac builds back to Mojave. Most of what I learned about reading guide logs, I learned by reading his code. So let me get this out of the way up front: this isn't me fixing something that was broken. Andy's tool works.
What I wanted was a Mac-native version. Something built around SwiftUI's DocumentGroup so File → Open and dropping a log onto the app icon both worked the way you'd expect, with charts drawn in Swift Charts and an interface that felt like it belonged on the same screen as the rest of my Mac apps. I also wanted to give back to the open-source astronomy community in a way that played to my strengths — designing software for Mac users.
But the bigger reason is what I think Ephemeris can become. The original PHD log viewer, like this v1, is informational. It shows you the numbers. It doesn't tell you what the numbers mean. I think a guide-log analyzer can do more than render a graph — it can help you read the graph. Especially if you're newer to autoguiding and haven't yet learned what 0.8″ RMS with persistent Dec drift looks like versus 0.8″ RMS from poor seeing. v1.0 doesn't do that yet. But it's the direction I'm pointed.
I've already taken a small first step. Ephemeris lets you ⌘-click sessions in the sidebar to combine them into one merged view, with real wall-clock gaps preserved between them. Drag-to-exclude works across the merge. Stats and FFT recompute on the merged session. It's a tiny enhancement, but it's the kind of thing I want to keep adding — small, useful, and aimed at the what do I do with this? question rather than the what does this say? question.
What's in v1.0
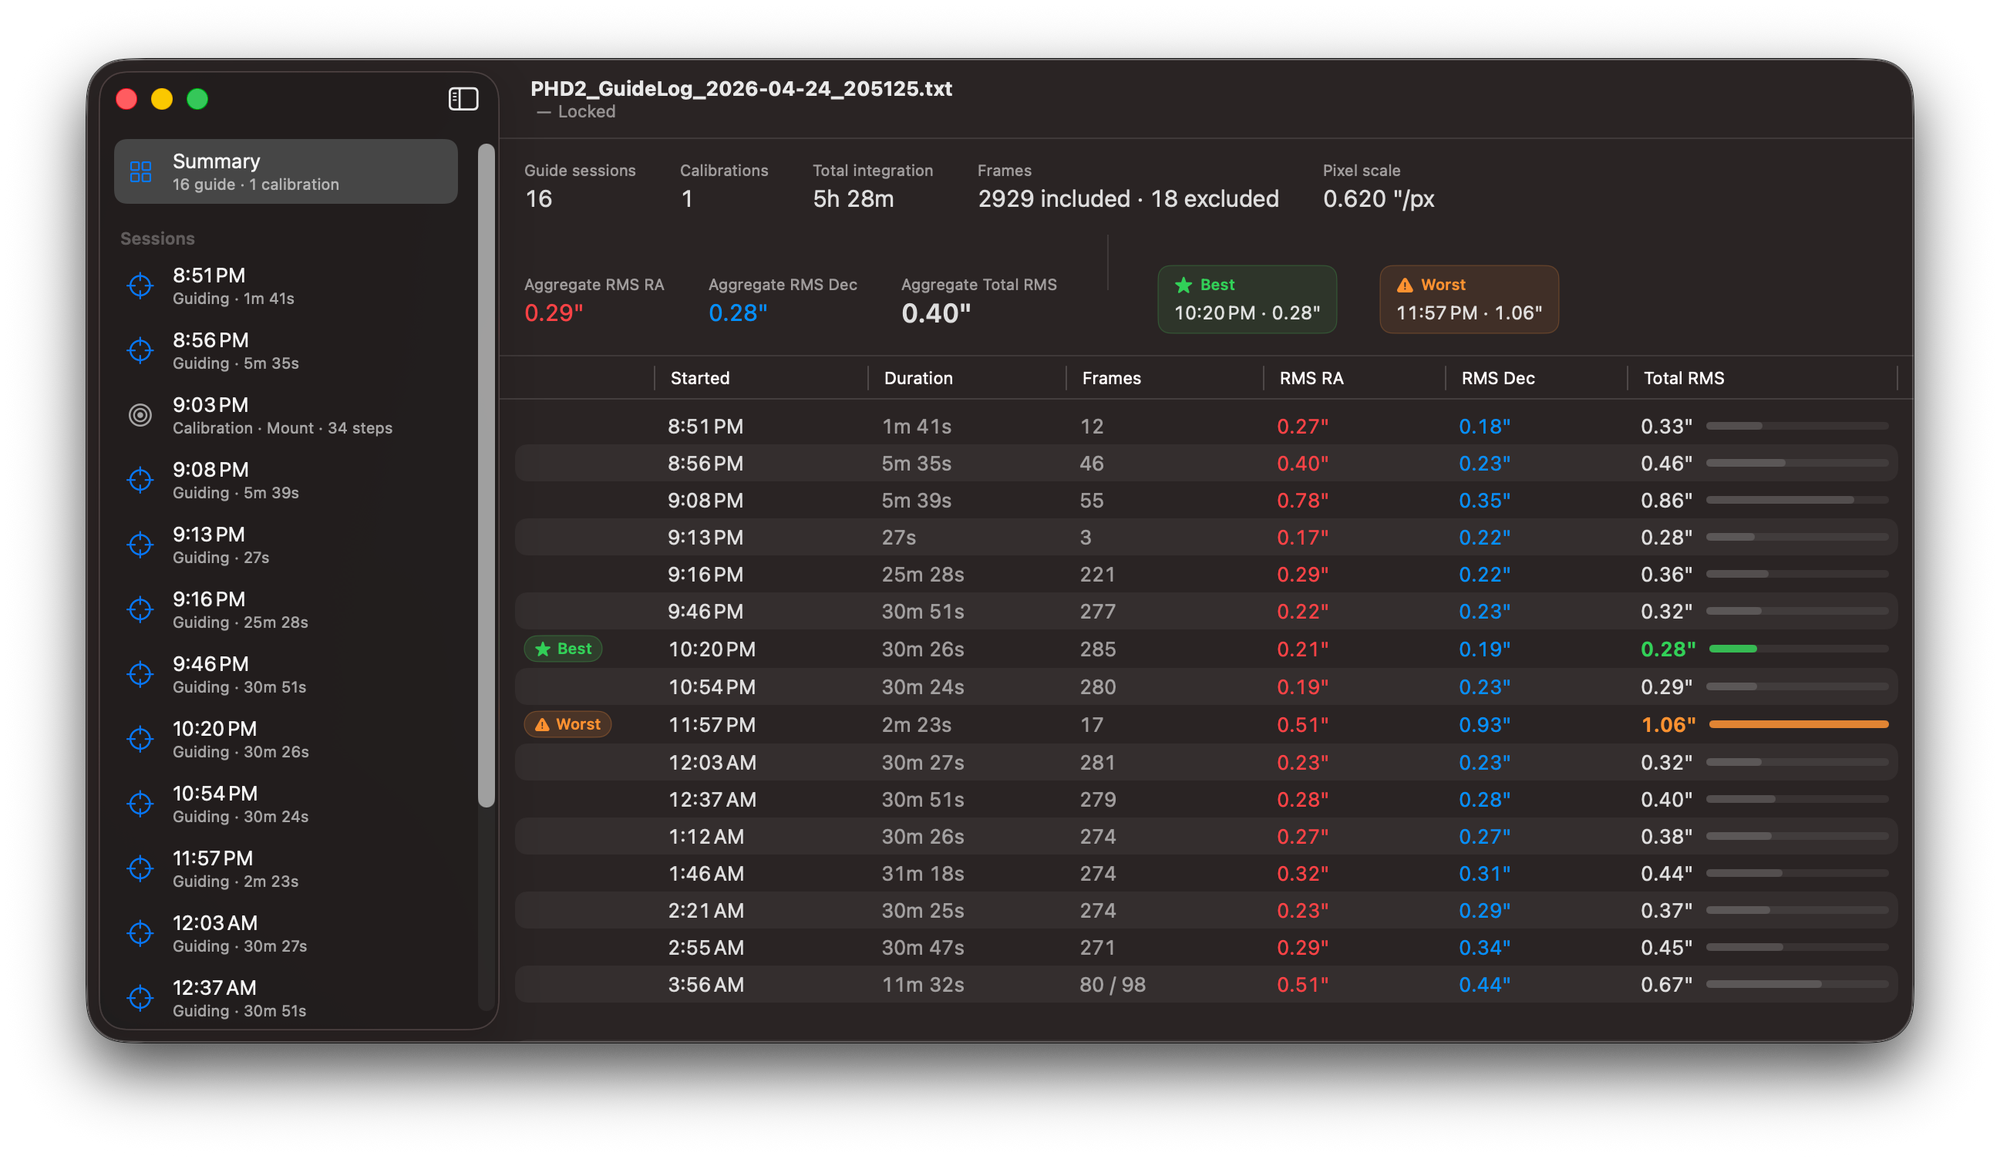
The summary view is what opens when you load a log. You get aggregate stats up top — total integration time, frame count, weighted RMS — and a sortable table of every guiding session in the file, with green ★ Best and orange ⚠︎ Worst pills marking your standout nights. The Total RMS column has a thin horizontal bar scaled to the worst session, so you can scan quality at a glance without having to read individual numbers.
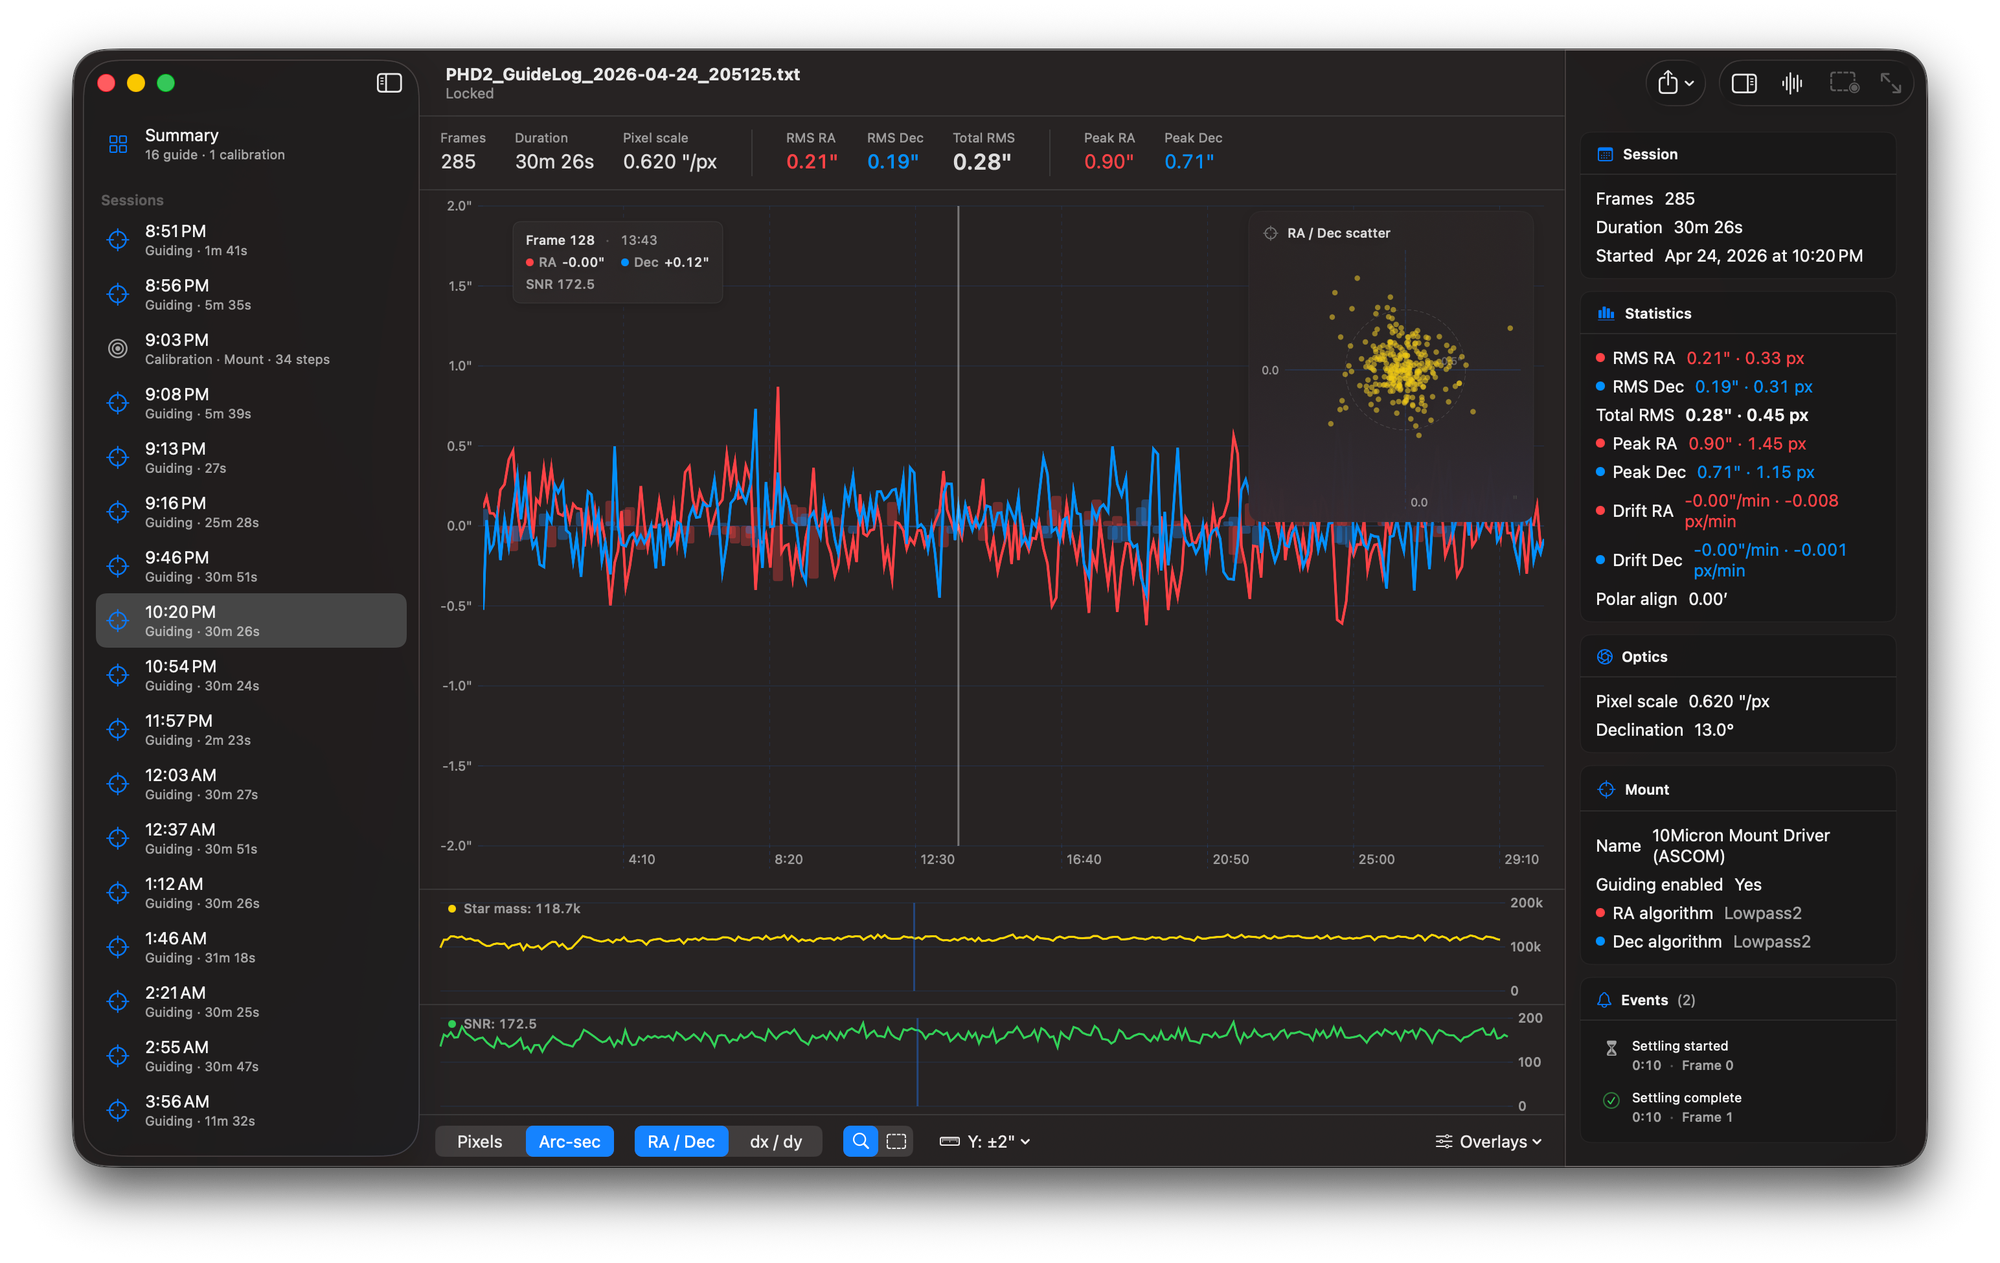
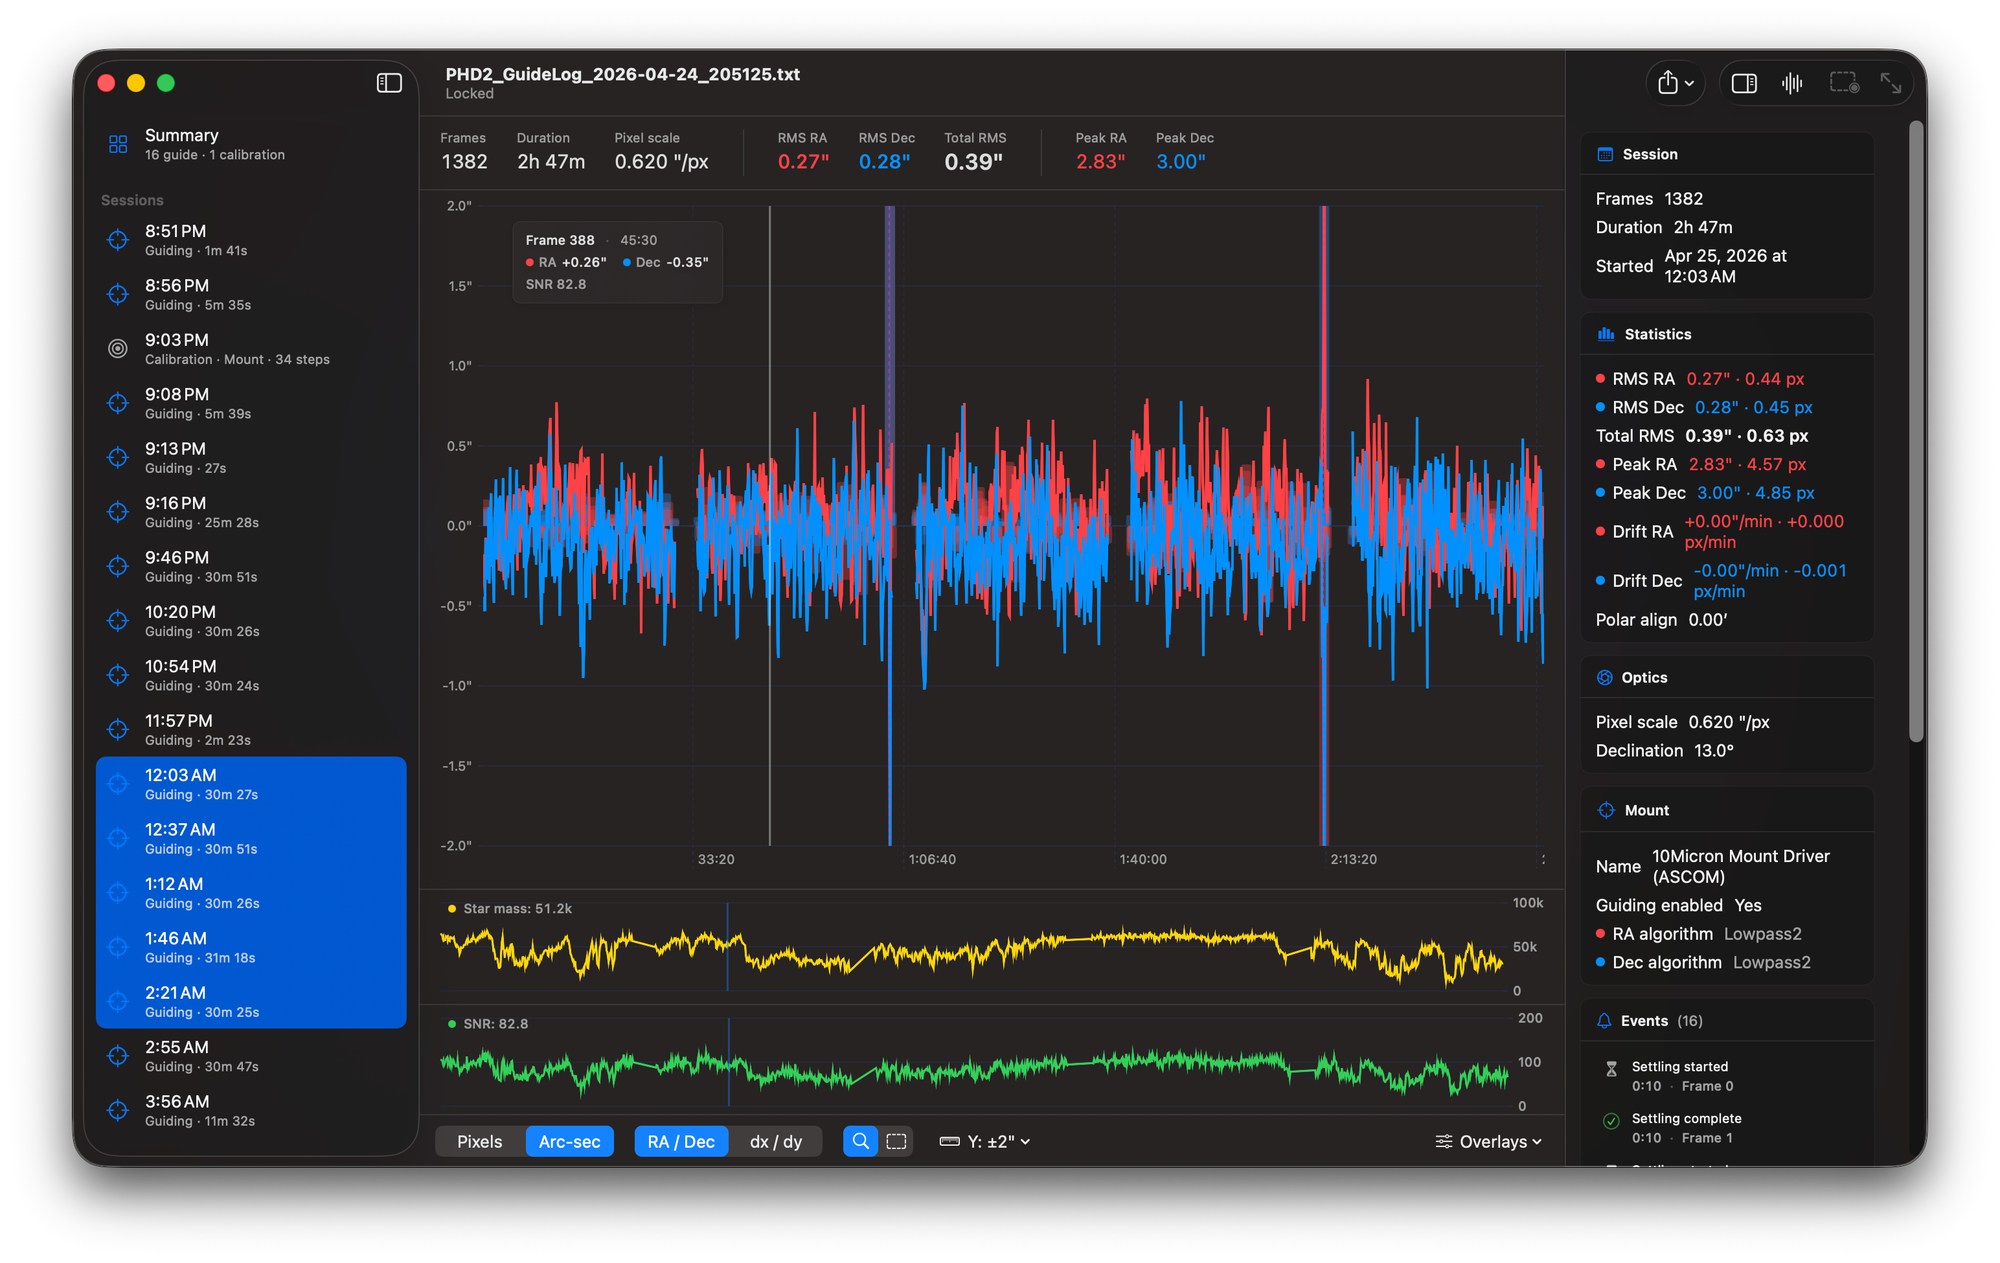
The per-session chart is built on Apple's Swift Charts. RA in red, Dec in blue, hover for a frame readout, click to pin a vertical rule. Drag to zoom; toggle the mode and drag to manually exclude a range from your stats. There's a translucent XY scatter inset in the corner with concentric rings every 0.5″ (matching PHD2's target convention), a star-mass sub-chart, an SNR sub-chart, and event markers for settling, dither, star-lost, and PHD2 parameter changes. Click an event in the inspector and the chart's selection rule snaps to that frame.
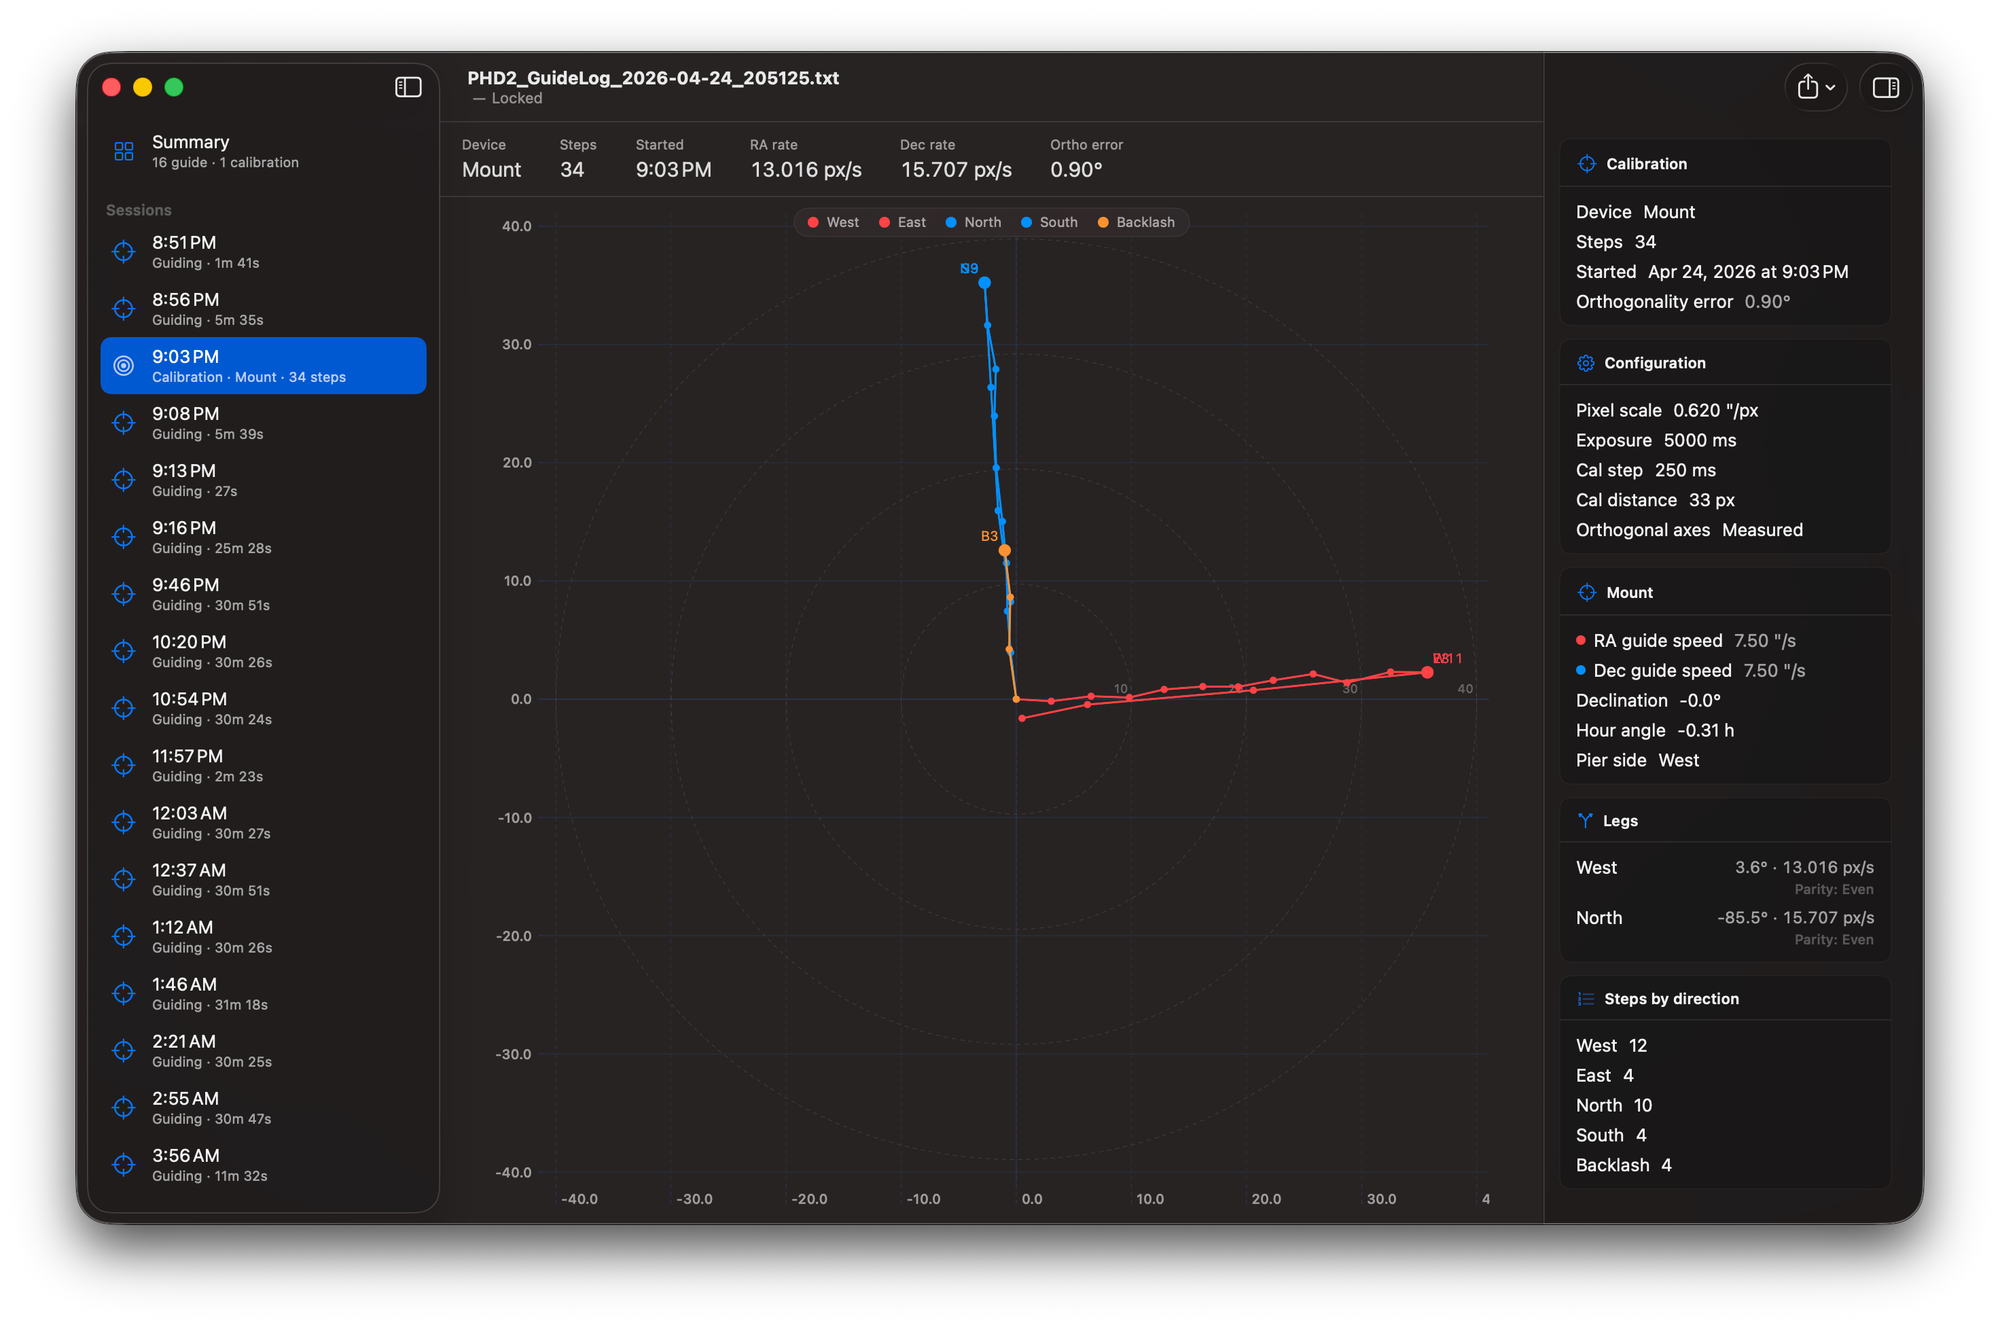
The calibration plot is square, 1:1, with West/East legs drawn in red and North/South in blue, plus orange backlash steps if your mount needed them. The stats strip across the top shows your RA and Dec rates plus orthogonality error — and if it's over 5°, that number turns orange to flag it. Worth catching before your imaging session, not after.
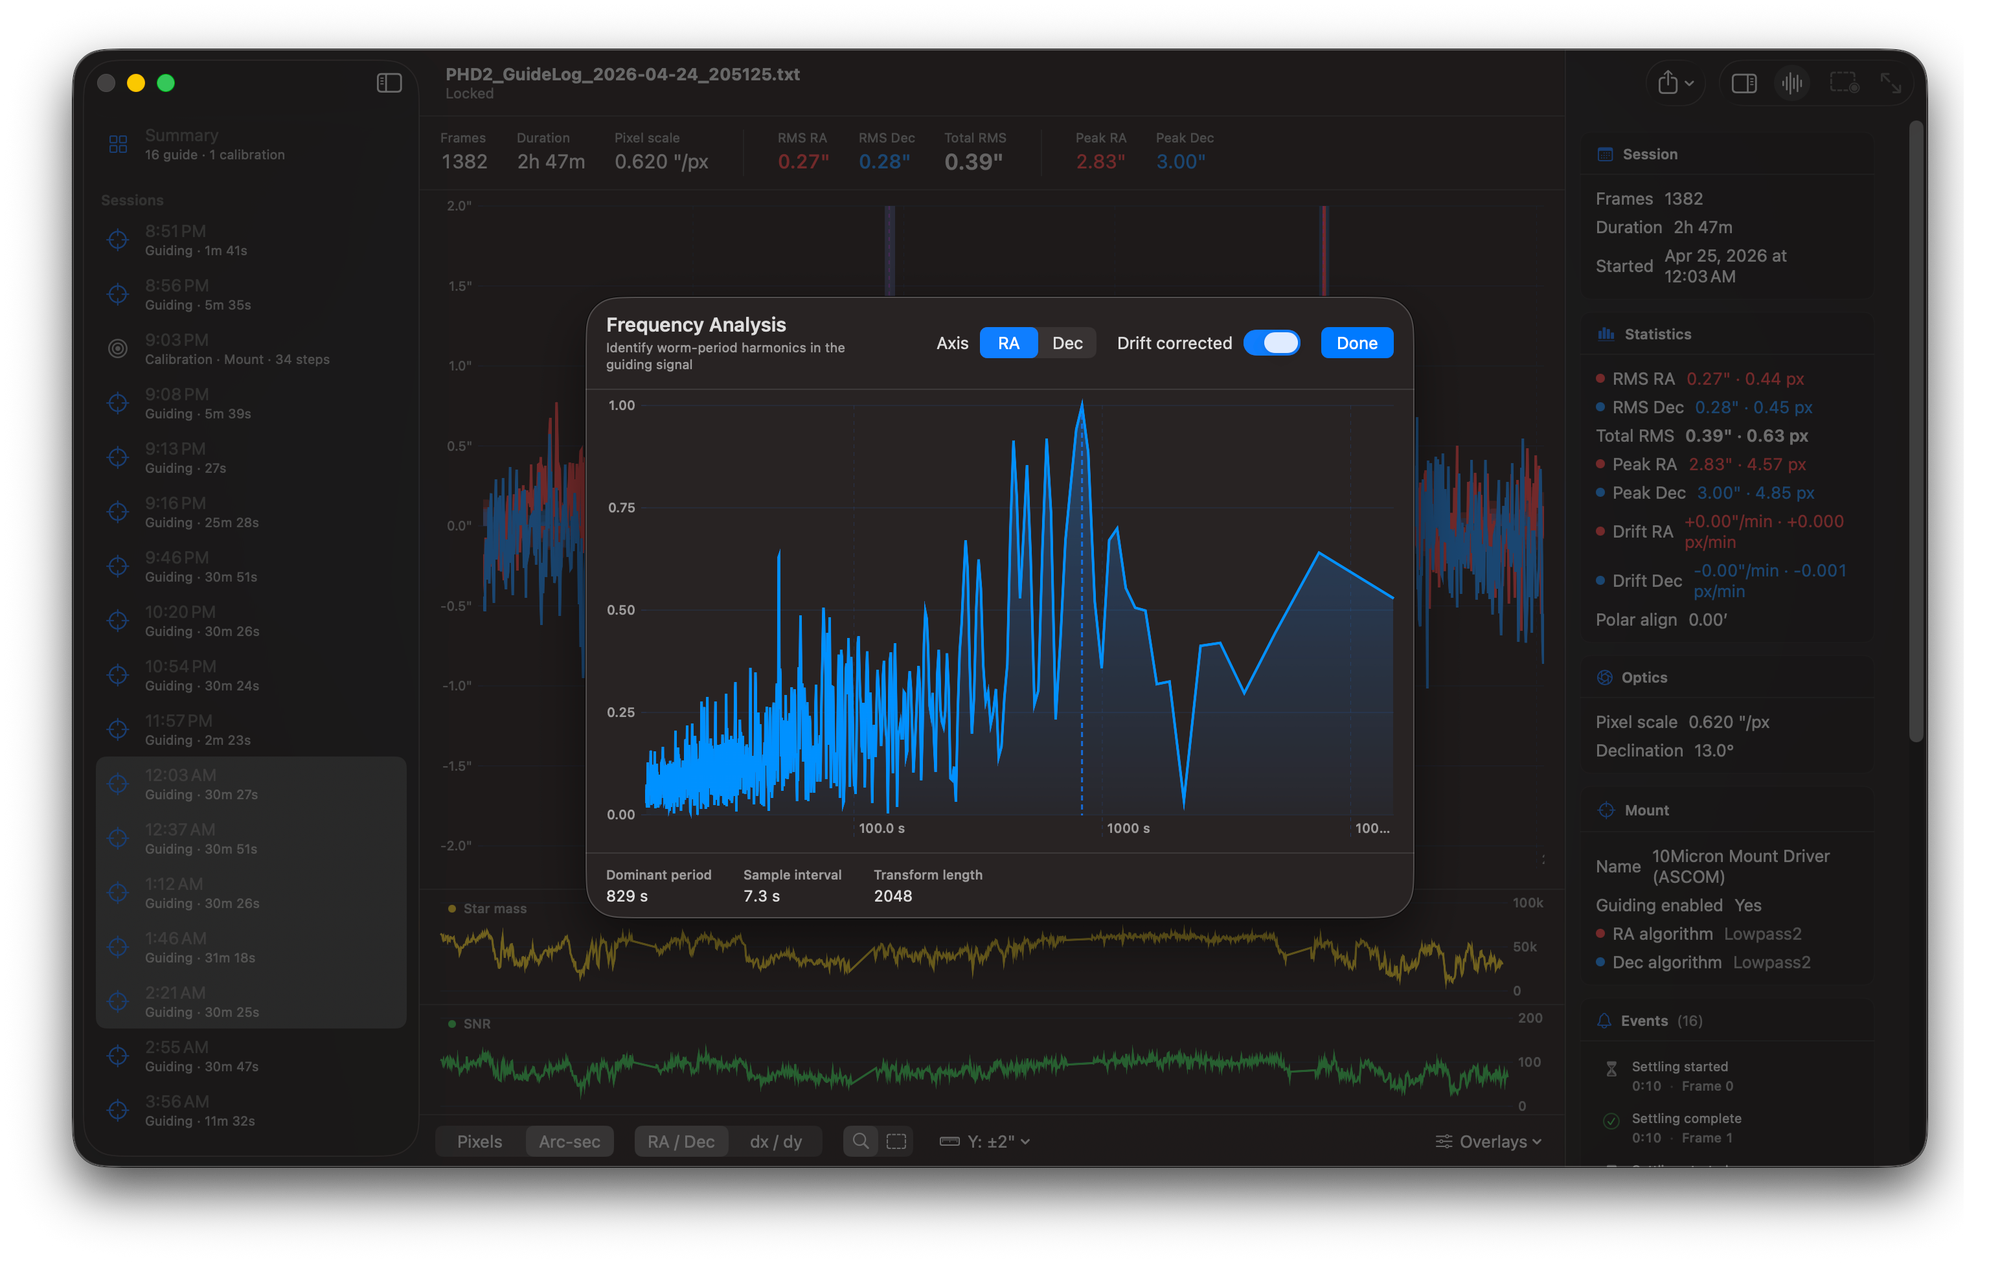
The FFT periodogram opens with ⌘F. Log-X axis, Hann-windowed, drift-corrected by default, with a vertical rule annotating the dominant period. It's built on Apple's Accelerate framework — no third-party dependencies, no GSL, no SPM packages.
A few other things worth knowing: the app is read-only on log files (it never modifies what it opens), exports go through the system share sheet (CSV of frames, CSV of session stats, log summary CSV, or a 2× PNG of the chart), there's an in-app Apple Help Book at ⌘? with nine topic pages, and the analysis code ships with around 56 unit tests covering parsing, statistics, FFT recovery, and the multi-session merger.
What v1.0 Doesn't Do
Cross-night comparison isn't there yet. Each window is one log file — if you want to look at last week's session and tonight's, that's two windows side by side. There's no PHD2 debug log support either; Ephemeris reads the guide log only. And the polar-alignment estimate is single-session, which means it works well on long sessions and gets noisy on short ones. I'd rather ship without those features than ship them poorly.
Where It's Going
The post-1.0 roadmap is the real reason I'm excited. Three things, in rough order: PHD2 debug log correlation, cross-session trend analysis, and a layer of plain-language interpretation on top of the numbers. The last of those I'm prototyping as an MCP server, so a chat assistant like Claude could read your guide logs directly and have an actual conversation with you about what's going on — "Your RA RMS doubled around 1am — was the wind picking up?" That kind of thing.
Get It
Ephemeris 1.0 is a free download at macobservatory.com — Developer ID signed and notarized, distributed direct from Mac Observatory. macOS 14 (Sonoma) or later, runs natively on Apple Silicon. Source is on GitHub under GPL-3.0, and Andy Galasso's phdlogview (the upstream project this learns from) is at github.com/agalasso/phdlogview. If you want to support continued development, there's a Patreon.
If you find a bug or have a feature you'd like to see — especially anything in the roadmap above — open an issue on GitHub or send me a note. v1.0 is the start, not the destination.